1.6 NA
NA is a logical constant of length 1 that contains a missing value indicator. The NA coding can identify some situations.
- ‘Not Available’, e.g. asking ‘what time is it?’ and there is no clock available.
- ‘Not Applicable’, e.g. asking ‘are you pregnant, sir?’
- ‘Not Announced/Answered’, e.g. being silent in an interrogation.
- ‘Not Accessed’, e.g. the student’s Moodle page was not accessed throughout the semester.
Example 1.9 Examples of using NA in R.
## [1] NA 1 2 3 NA 1000## [1] TRUE FALSE FALSE FALSE TRUE FALSE## [1] 2## [1] TRUEExample 1.10 In Python.
import numpy as np
# Creating an array with numeric values and NAs
x = np.array([np.nan, 1, 2, 3, np.nan, 1000])
# Checking which elements are NAs
print(np.isnan(x)) # Output: [True False False False True False]
# Counting the number of NAs
print(np.isnan(x).sum()) # Output: 2
# Checking if there are any NAs in the array
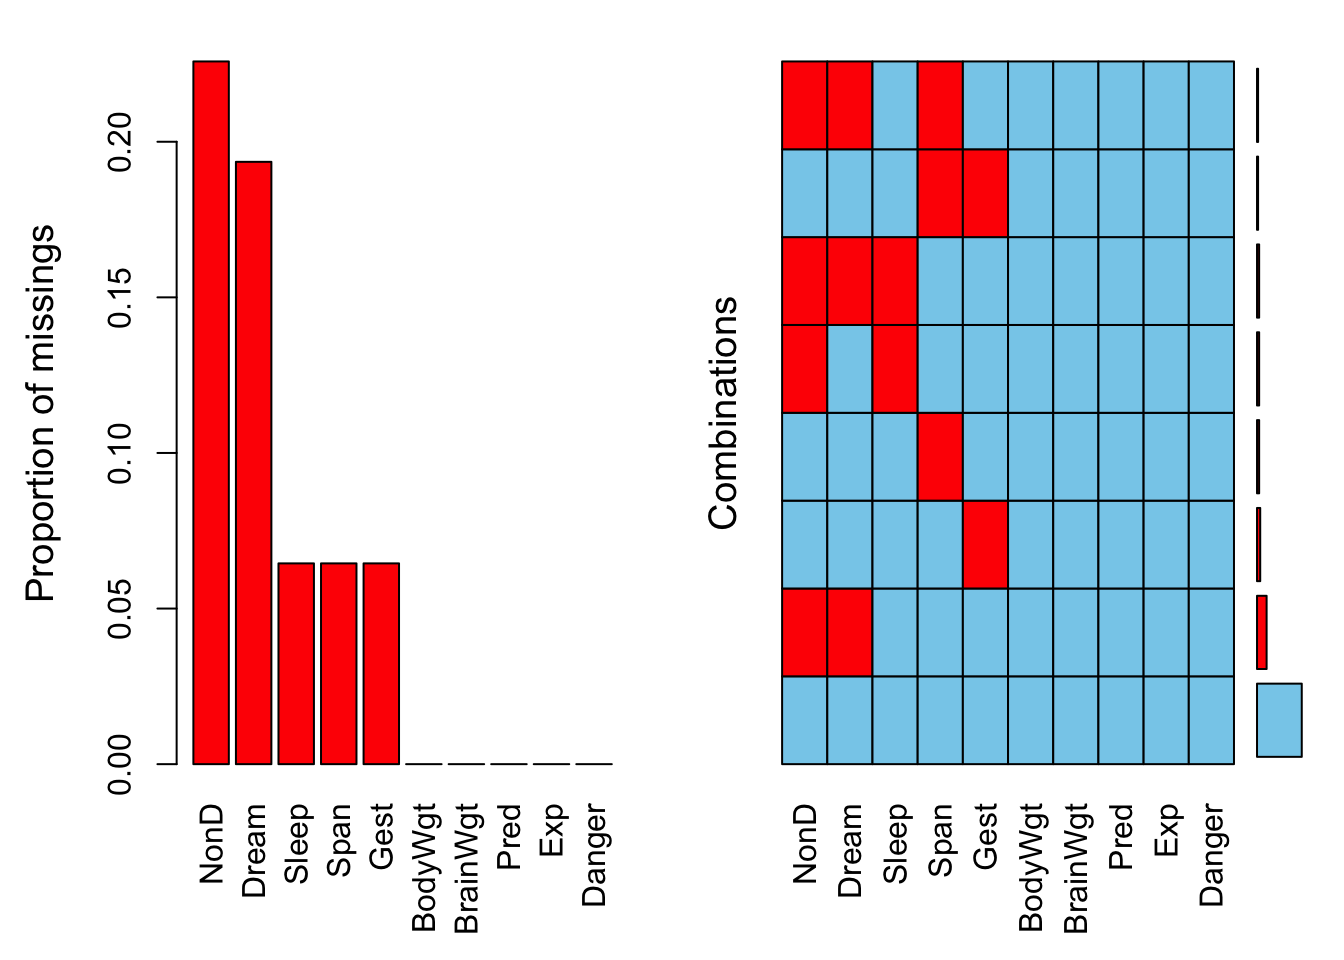
print(np.any(np.isnan(x))) # Output: TrueExample 1.11 (Kowarik and Templ 2016)’s VIM library provides tools for visualizing missing and imputed values. The example makes use of the mammalian sleep database discussed by (Allison and Cicchetti 1976).
##
##  Variables sorted by number of missings:
##  Variable      Count
##      NonD 0.22580645
##     Dream 0.19354839
##     Sleep 0.06451613
##      Span 0.06451613
##      Gest 0.06451613
##   BodyWgt 0.00000000
##  BrainWgt 0.00000000
##      Pred 0.00000000
##       Exp 0.00000000
##    Danger 0.00000000
##
## Missings in variables:
## Variable Count
## NonD 14
## Dream 12
## Sleep 4
## Span 4
## Gest 4##
## Missings per variable:
## Variable Count
## BodyWgt 0
## BrainWgt 0
## NonD 14
## Dream 12
## Sleep 4
## Span 4
## Gest 4
## Pred 0
## Exp 0
## Danger 0
##
## Missings in combinations of variables:
## Combinations Count Percent
## 0:0:0:0:0:0:0:0:0:0 42 67.741935
## 0:0:0:0:0:0:1:0:0:0 3 4.838710
## 0:0:0:0:0:1:0:0:0:0 2 3.225806
## 0:0:0:0:0:1:1:0:0:0 1 1.612903
## 0:0:1:0:1:0:0:0:0:0 2 3.225806
## 0:0:1:1:0:0:0:0:0:0 9 14.516129
## 0:0:1:1:0:1:0:0:0:0 1 1.612903
## 0:0:1:1:1:0:0:0:0:0 2 3.225806Example 1.12 In Python.
import pandas as pd
from matplotlib import pyplot as plt
import missingno as msno

# Loading the Allison and Cicchetti (1976) dataset
url = 'https://vincentarelbundock.github.io/Rdatasets/csv/openintro/mammals.csv'
sleep = pd.read_csv(url)

# Calculating the missing data matrix
missing_data = sleep.isnull()

# Creating the missing data matrix plot
msno.matrix(sleep, sort='descending')
plt.show()

# Displaying summary statistics for missing data
print(missing_data.describe())
References
Allison, Truett, and Domenic V Cicchetti. 1976. “Sleep in Mammals: Ecological and Constitutional Correlates.” Science 194 (4266): 732–34.
Kowarik, Alexander, and Matthias Templ. 2016. “Imputation with the R Package VIM.” Journal of Statistical Software 74 (7): 1–16. https://doi.org/10.18637/jss.v074.i07.