3.10 R as table
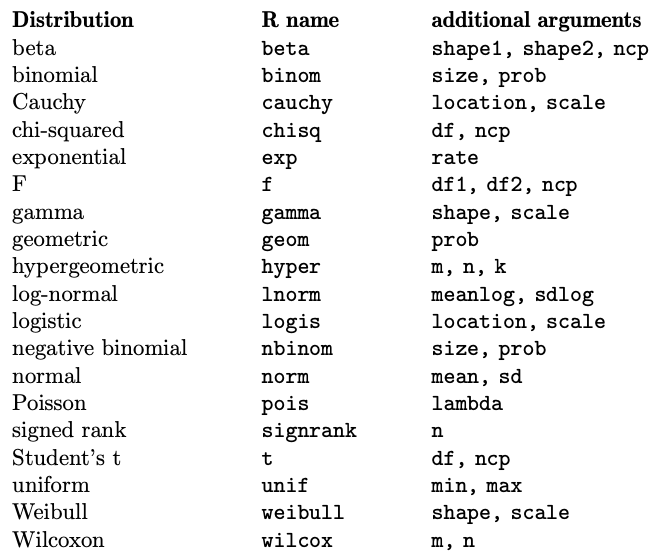
(Venables et al. 2023, 33) point out that a convenient use of R is to provide a comprehensive set of statistical tables. Functions are provided to evaluate the probability density function (PDF) \(f(x)\), the cumulative distribution function (FDA) \(F(x) = Pr(X \le x)\), the quantile function (given \(q\) , the smallest \(x\) such that \(Pr(X \le x) > q\)) and also to simulate distribution values. The prefix d is used for density, p for ADF, q for the quantile function and r for pseudo-random simulation. Below are the probability distributions available in base R. For more distributions, you can use the additional packages described in Section 3.9.
References
Venables, William N, David M Smith, R Development Core Team, et al. 2023. “An introduction to R.” Citeseer. https://cran.r-project.org/doc/manuals/r-release/R-intro.pdf.