8.3 Análise de Correlação Canônica
[T]he problem of finding a linear function of the criterion variates which can most accurately be predicted from given observations, in the sense of least squares, admits a definite solution, which we shall set forth. (Hotelling 1935, 1)
(Hotelling 1935) deu as bases da análise de correlação canônica, ainda que (Jordan 1875) já tivesse estudado o conceito de ângulos canônicos ou principais, i.e., ângulos entre linhas e planos no espaço.
If there are \(p\) variates which may be called “predicters”, such as scores in college entrance examinations of various kinds, and \(q\) others which will be called the “criteria”, such as college grades, of which some function to be chosen is to be predicted, let us denote these variates by \(x_i\) and \(x_{\alpha}\) respectively. (Hotelling 1935, 1)
Considere por simplicidade \(X \equiv x_i\), \(Y \equiv x_{\alpha}\). Deseja-se encontrar as combinações lineares
\[\begin{equation} U = a^{T}X \tag{8.2} \end{equation}\]
\[\begin{equation} V = b^{T}Y \tag{8.3} \end{equation}\]
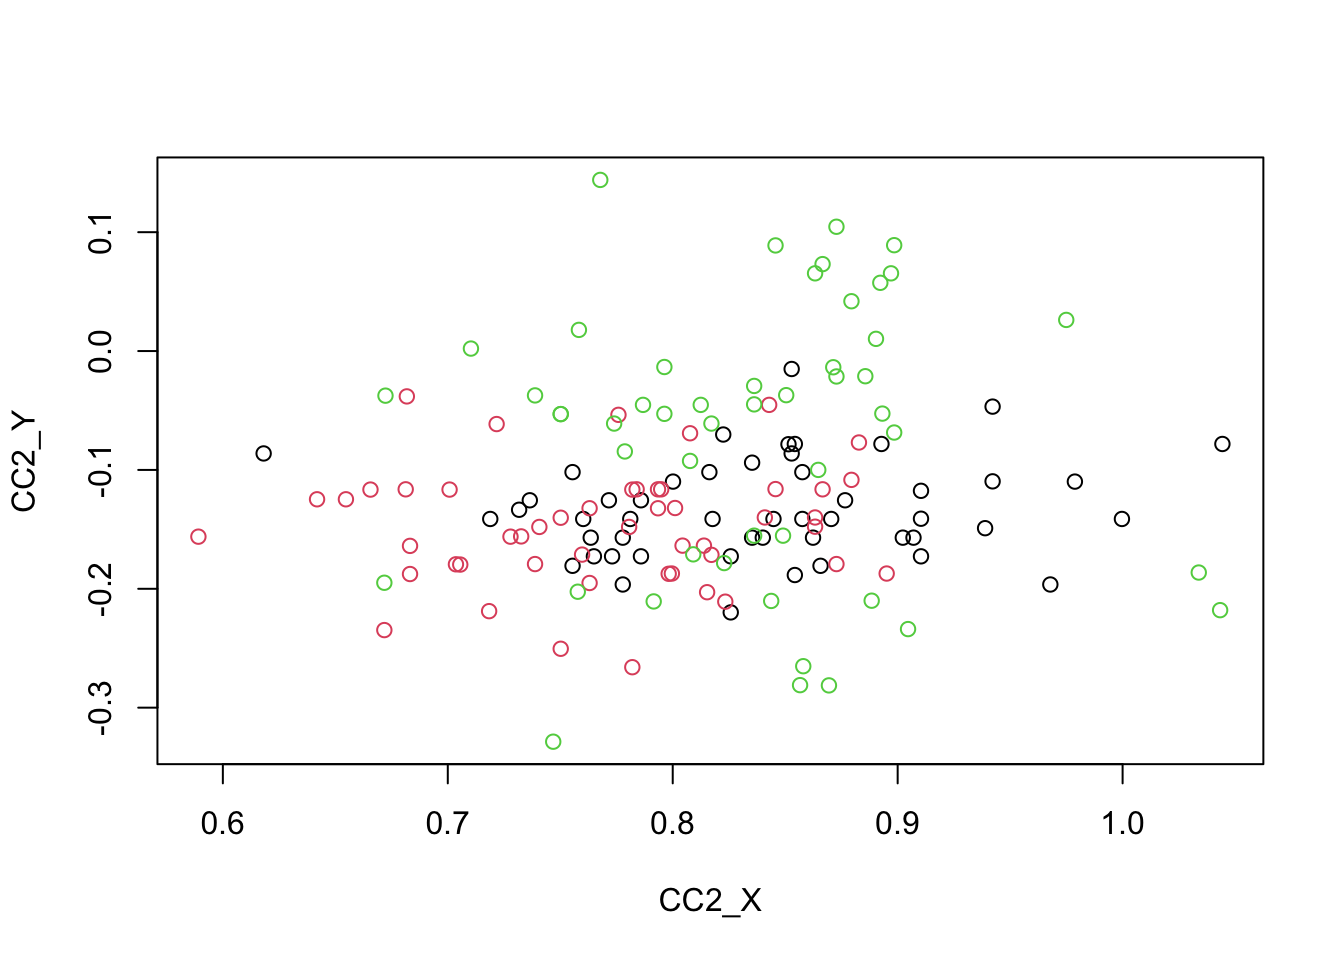
tais que a correlação entre \(U\) e \(V\) seja máxima, chamado primeiro par de variáveis canônicas. Ao se maximizar novamente a correlação, porém restrito a ser não correlacionado com \(U\) e \(V\), obtém-se o segundo par de variáveis canônicas.
8.3.1 stats::cancor
The canonical correlation analysis seeks linear combinations of the y variables which are well explained by linear combinations of the x variables. The relationship is symmetric as ‘well explained’ is measured by correlations. Documentação da função
stats::cancor.
## signs of results are random
X <- iris[, 1:2] # sépala
Y <- iris[, 3:4] # pétala
(cc_fit <- stats::cancor(X, Y))
## $cor
## [1] 0.9409690 0.1239369
##
## $xcoef
## [,1] [,2]
## Sepal.Length -0.08757435 0.04749411
## Sepal.Width 0.07004363 0.17582970
##
## $ycoef
## [,1] [,2]
## Petal.Length -0.06956302 -0.1571867
## Petal.Width 0.05683849 0.3940121
##
## $xcenter
## Sepal.Length Sepal.Width
## 5.843333 3.057333
##
## $ycenter
## Petal.Length Petal.Width
## 3.758000 1.199333## Sepal.Length Sepal.Width Petal.Length Petal.Width
## 5.843333 3.057333 3.758000 1.199333Calculando o primeiro e segundo pares de variáveis canônicas.
# primeiro par de variáveis canônicas
CC1_X <- as.matrix(X) %*% cc_fit$xcoef[, 1]
CC1_Y <- as.matrix(Y) %*% cc_fit$ycoef[, 1]
# segundo par de variáveis canônicas
CC2_X <- as.matrix(X) %*% cc_fit$xcoef[, 2]
CC2_Y <- as.matrix(Y) %*% cc_fit$ycoef[, 2]
# verificando as correlações
cor(CC1_X, CC1_Y)
## [,1]
## [1,] 0.940969## [,1]
## [1,] 0.1239369

8.3.2 Outros pacotes
CCAde González and Déjean (2021) fornece um conjunto de funções que estendem a funçãostats::cancor()com novas saídas numéricas e gráficas. Inclui uma extensão regularizada da análise de correlação canônica para lidar com conjuntos de dados com mais variáveis do que observações e permite lidar com valores ausentes.CCPde Menzel (2022) apresenta um conjunto de funções para realização de testes de significância para Análise de Correlação Canônica.