8.5 Perseguição da Projeção
The term “projection pursuit” was first used by (Friedman and Tukey 1974) to name a technique for the exploratory analysis of reasonably large and reasonably multivariate data sets; projection pursuit reveals structure in the original data by offering selected low-dimensional orthogonal projections of it for inspection. (Jones and Sibson 1987)

bustandthat indicesbasedonL2-divergencesarealsothemostrobustintheirclas
“(Nason 2001) found the Student’s indices are general ymore robust and that indices based on L2-divergences are also the most rob”
A biblioteca NORMT3 de Guy P. Nason, dentre outras funcionalidades, avalia as densidades de t de Student esféricas, bem como da soma de distribuições gaussianas e t de Student.
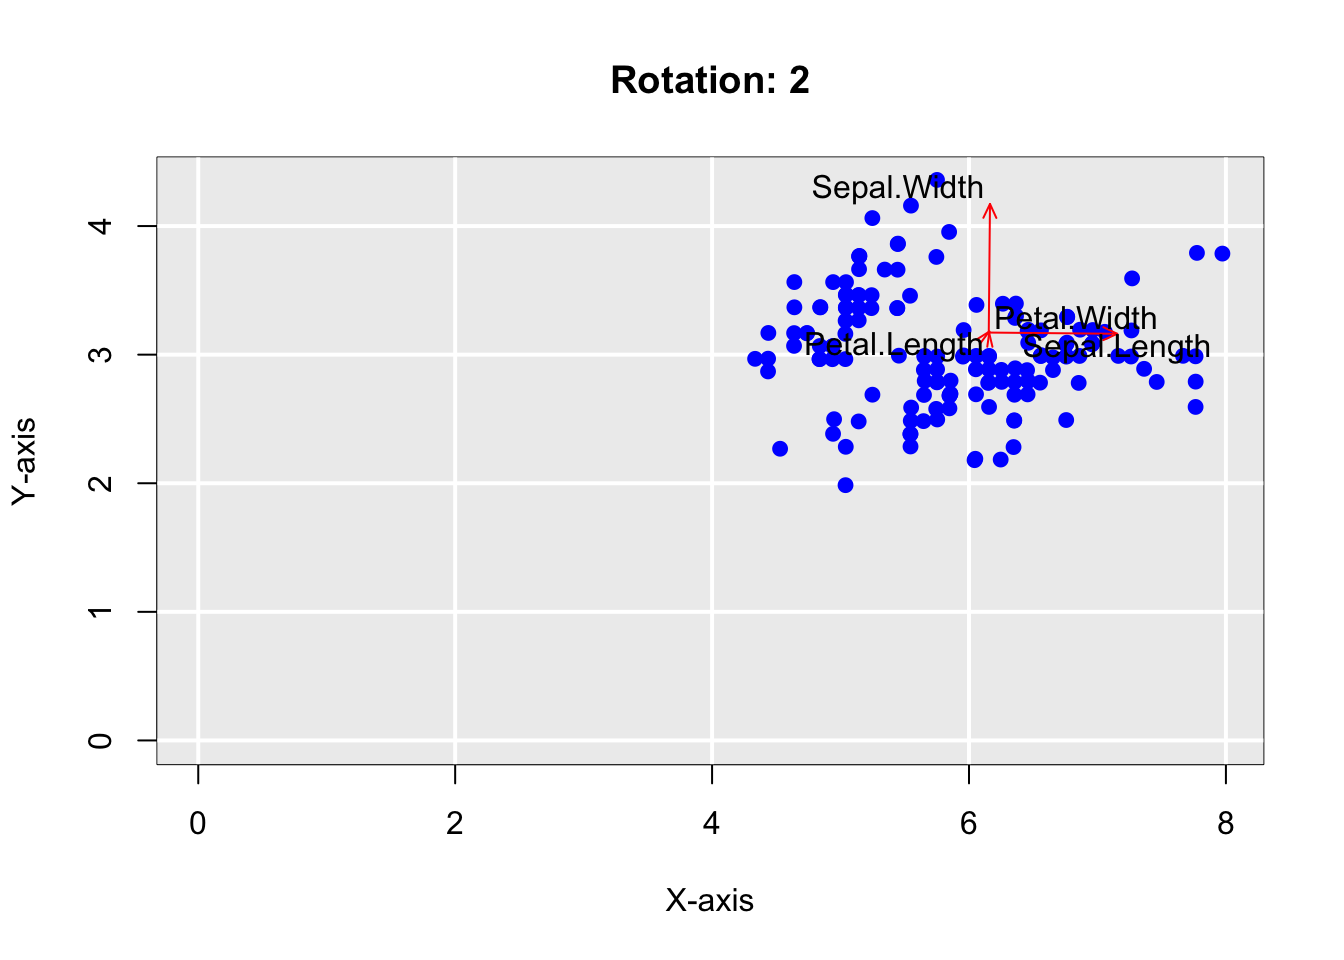
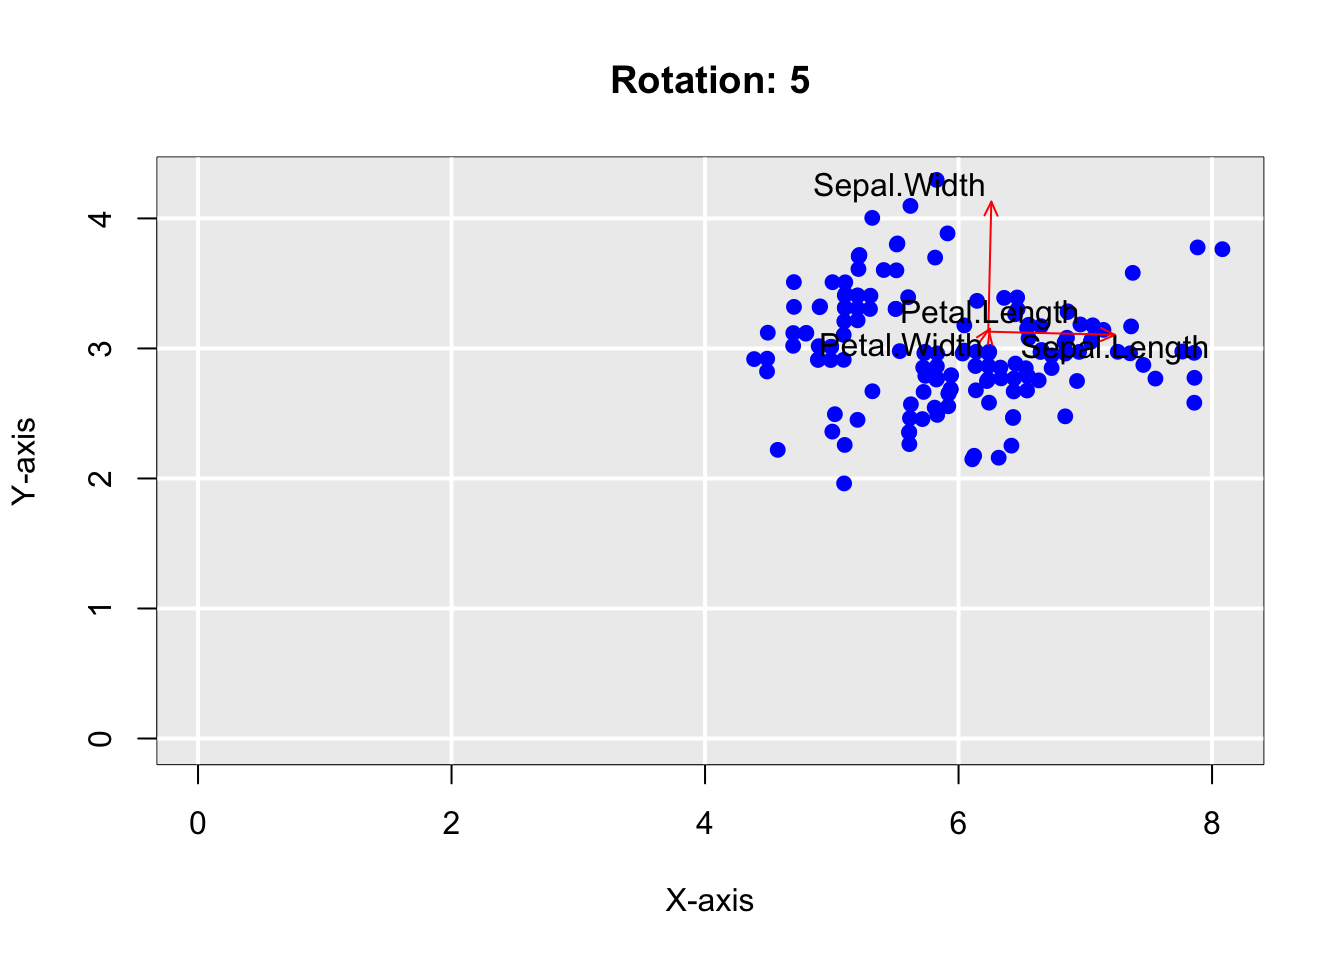
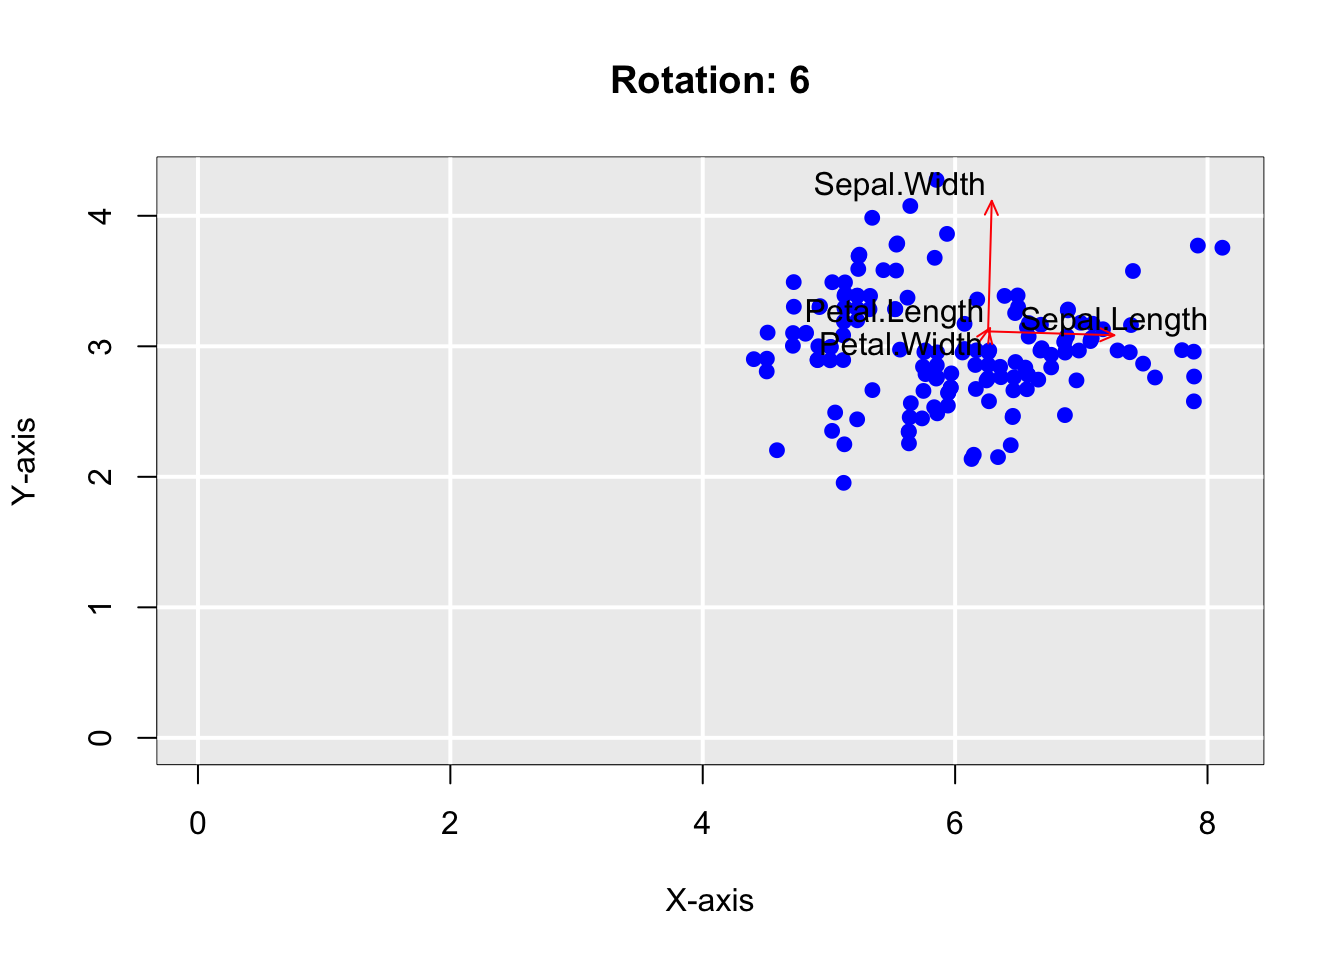
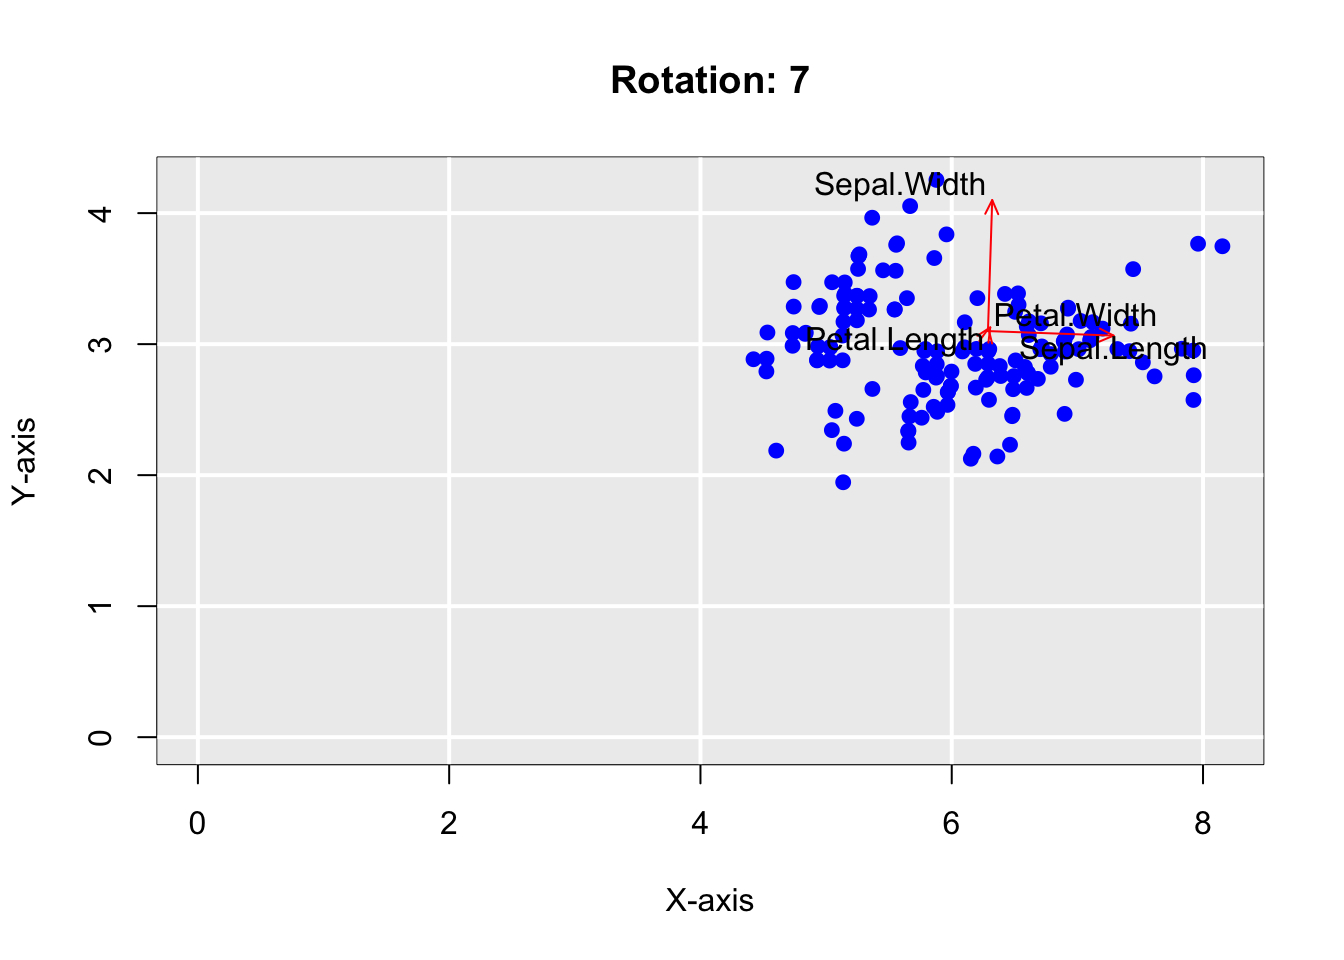
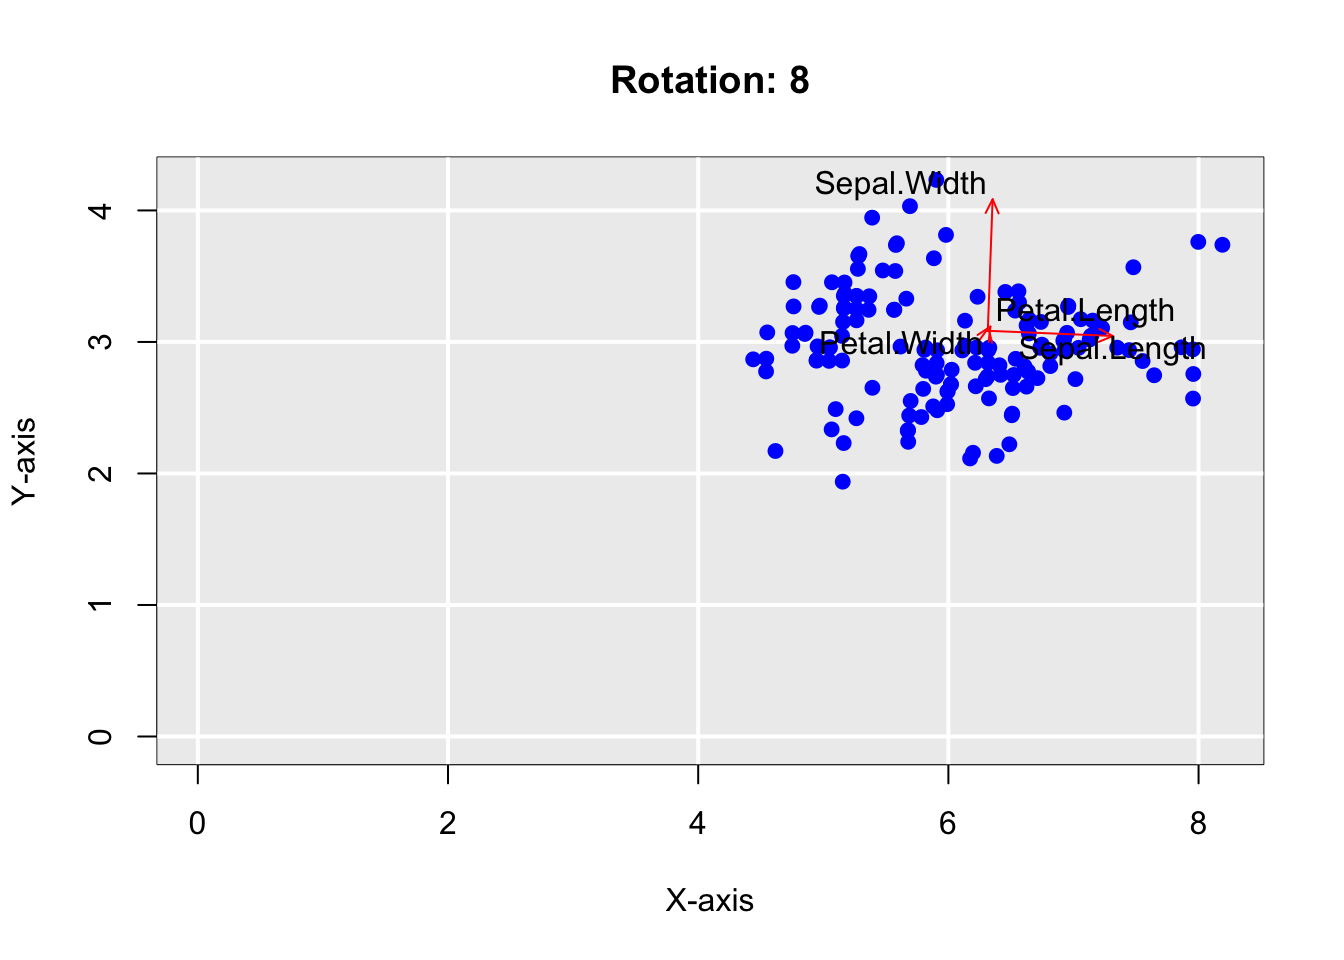
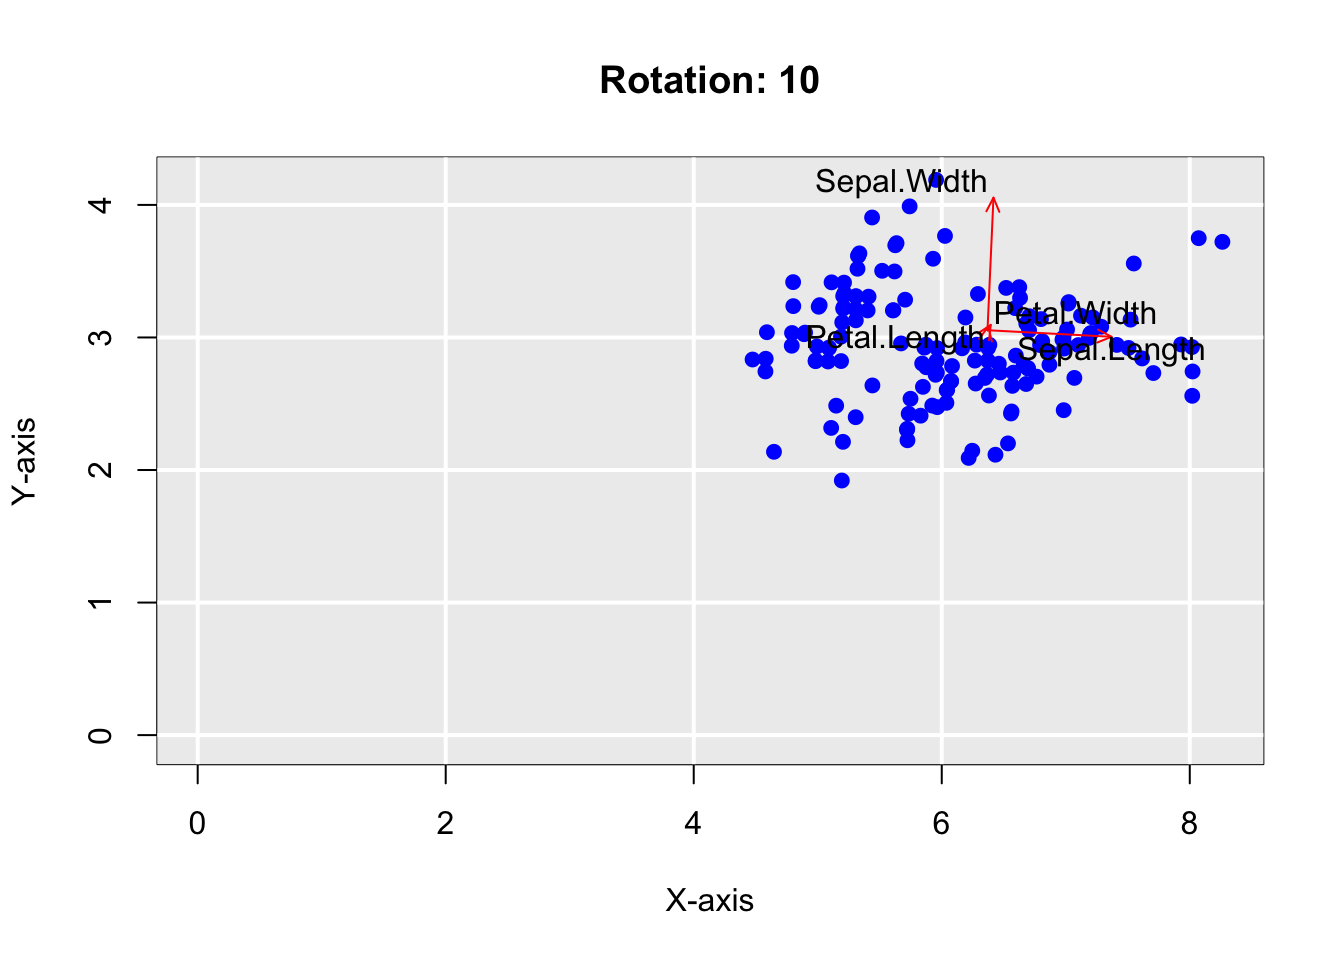
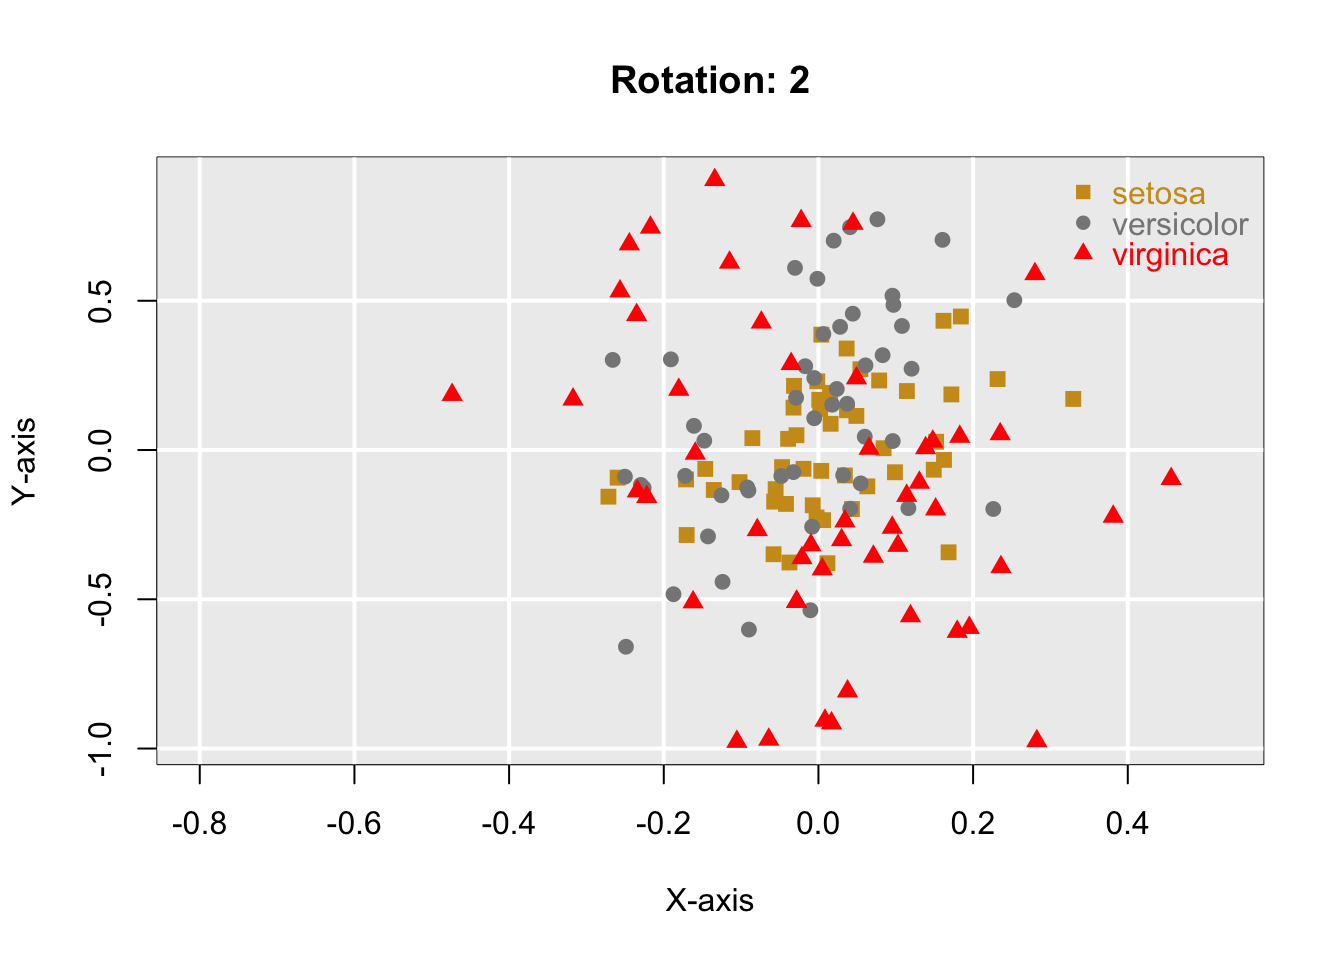
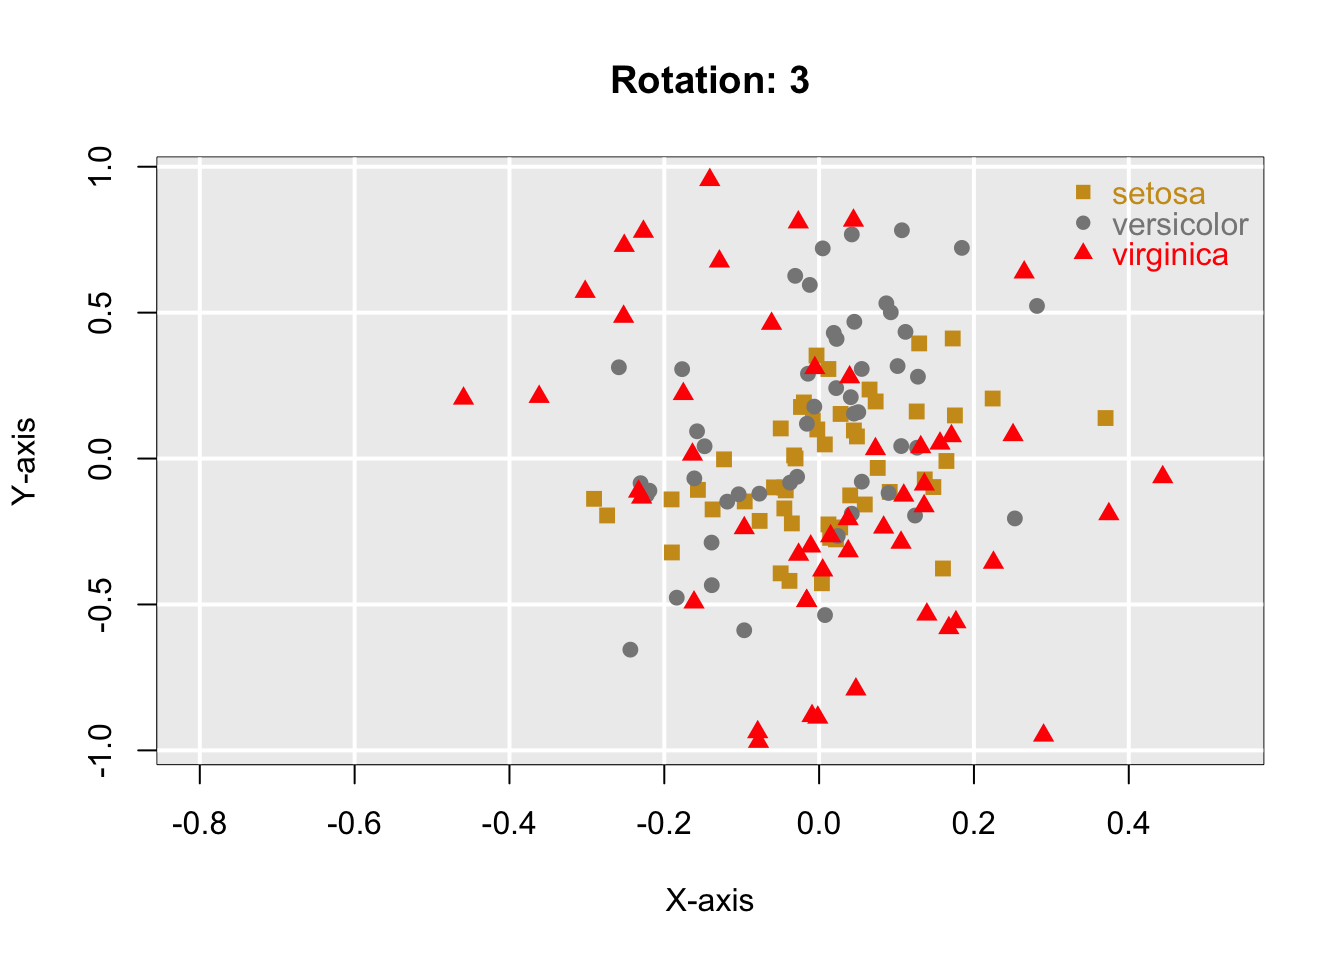
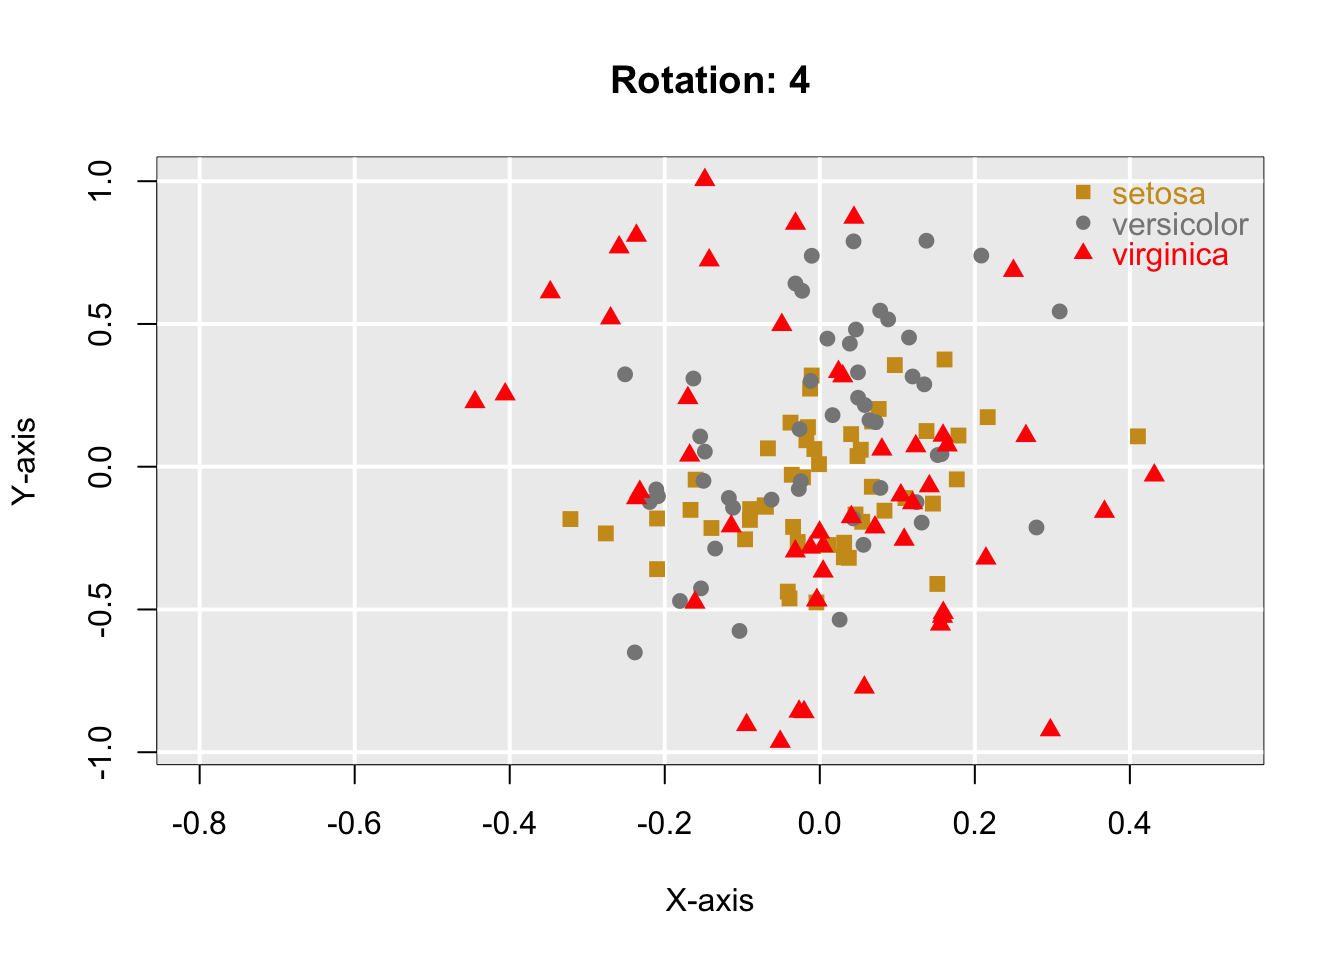
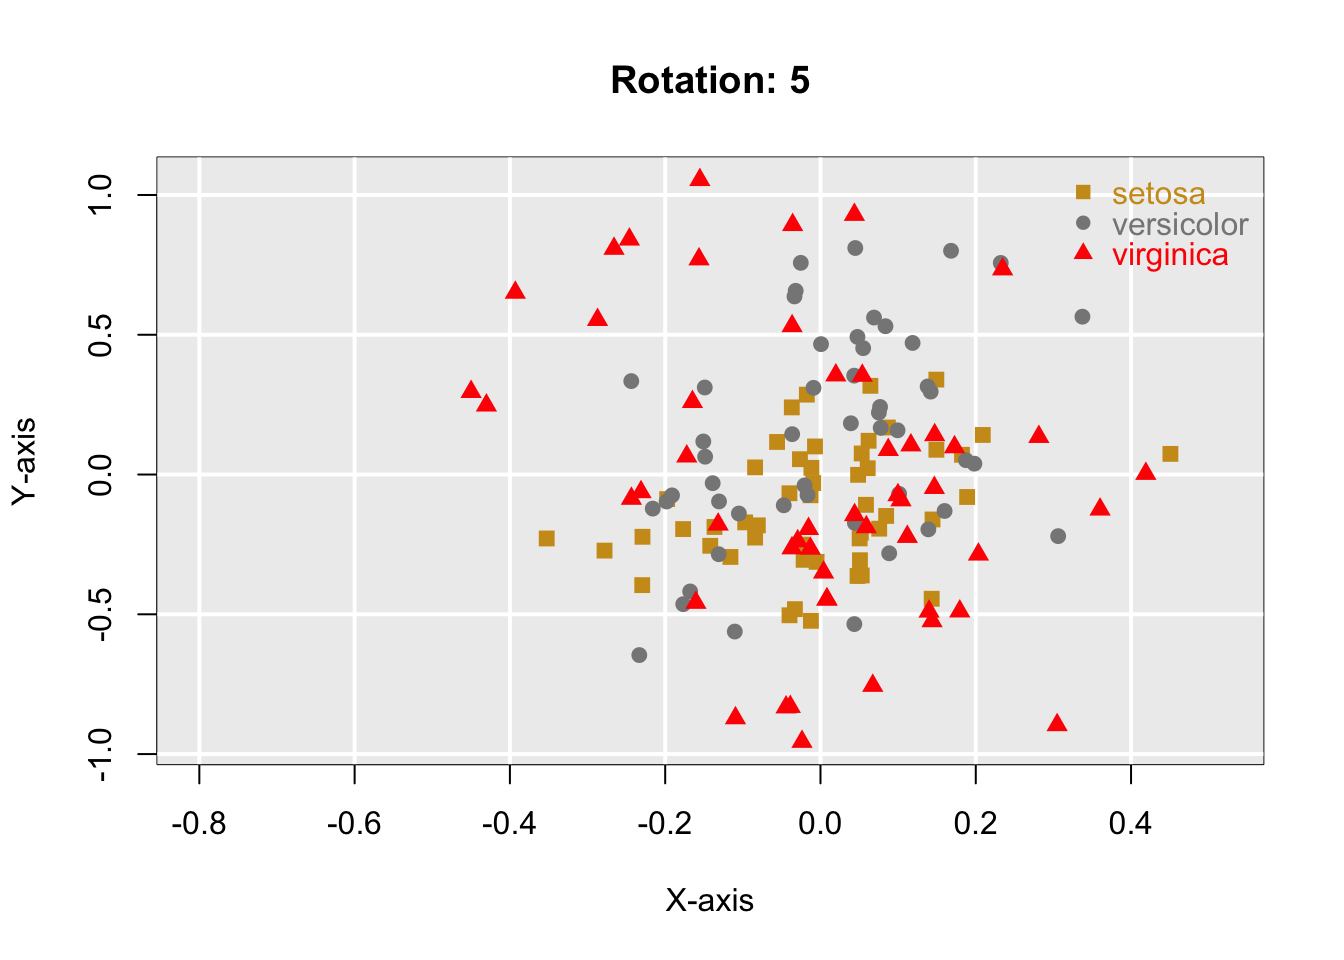
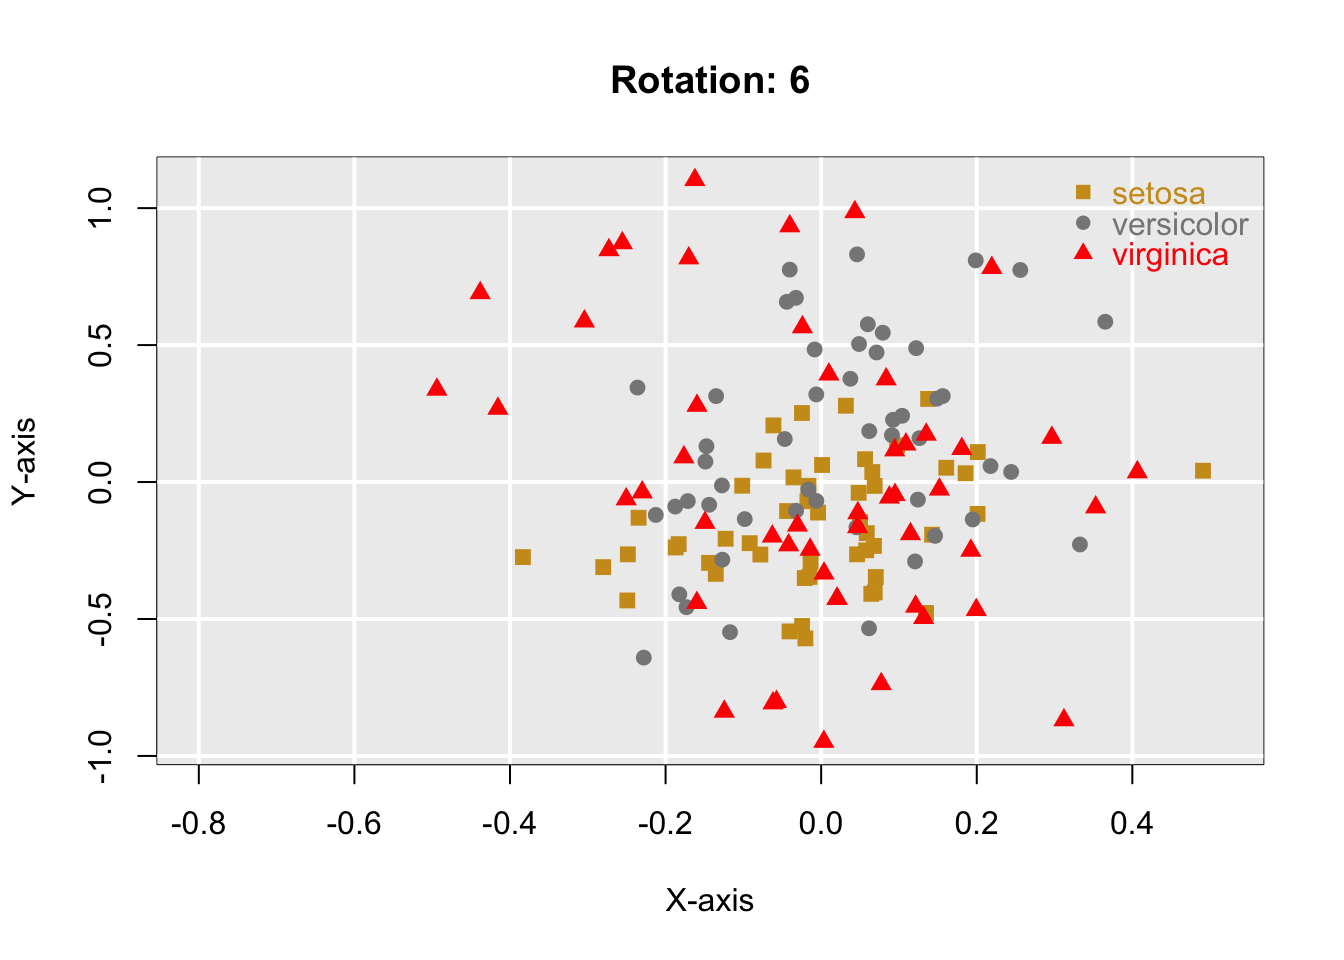
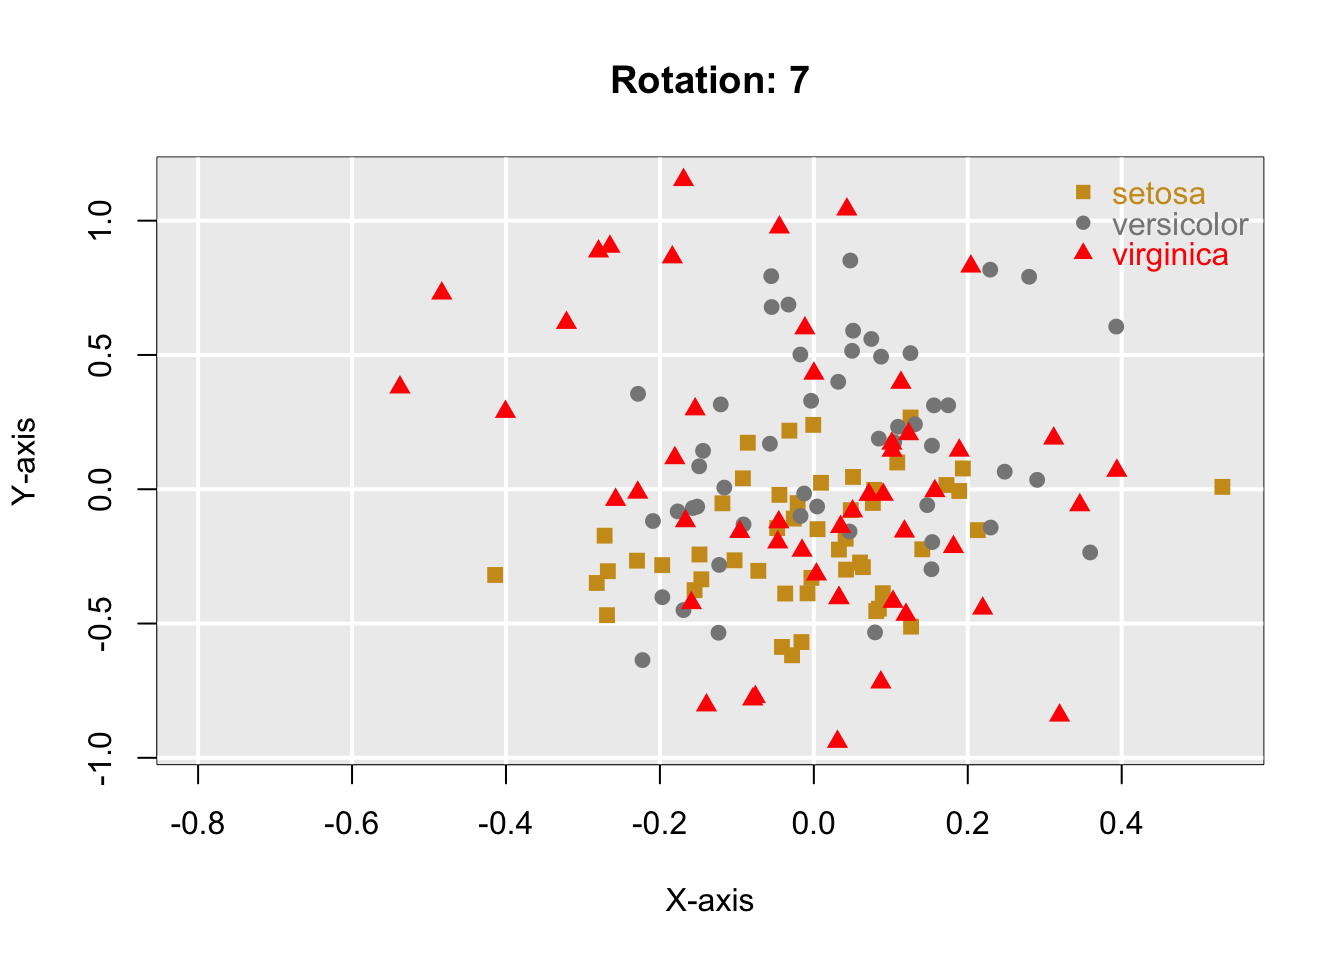
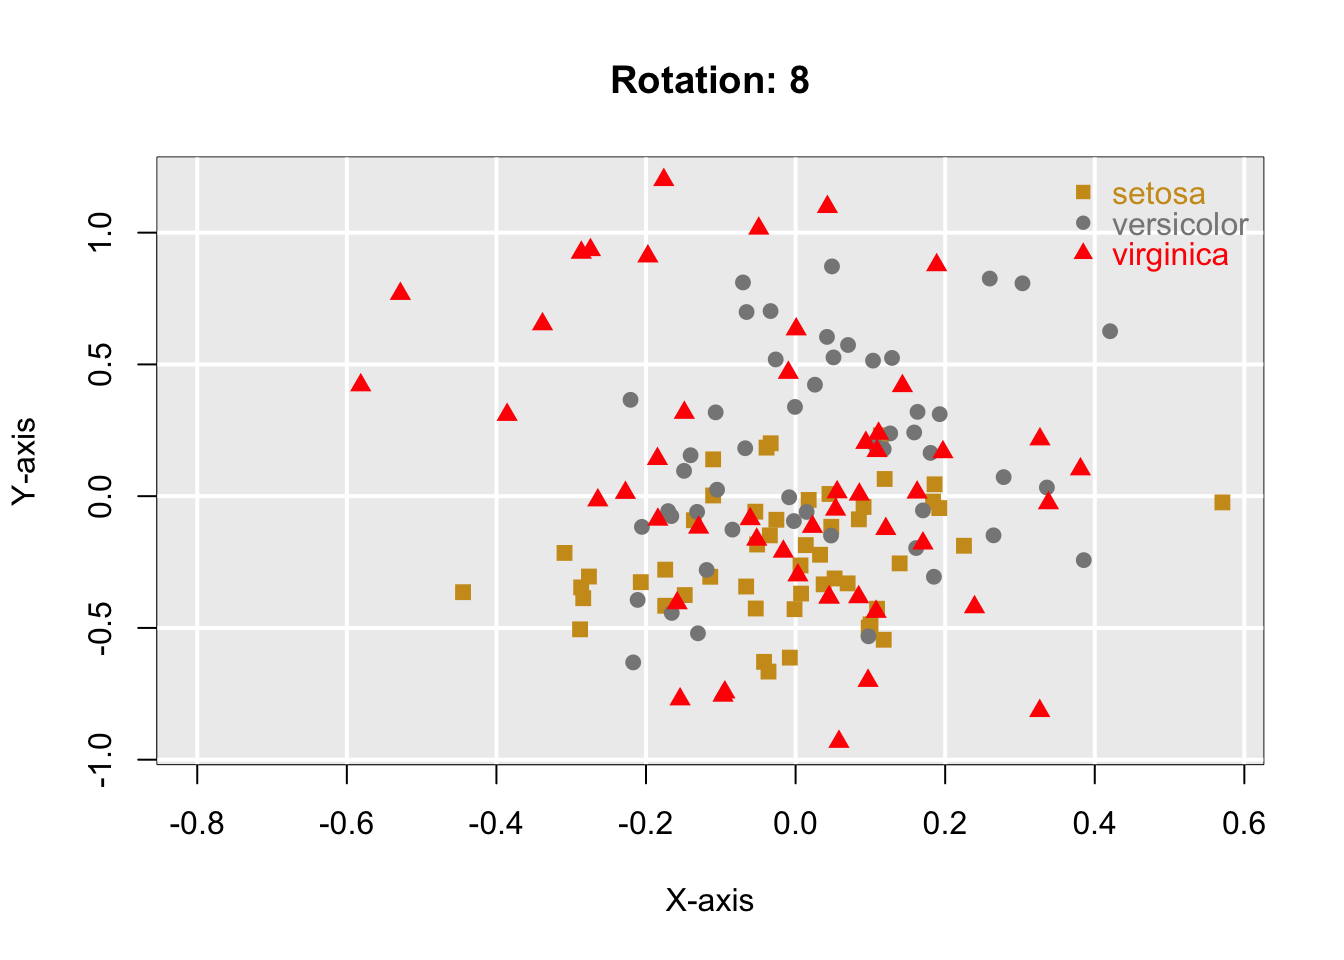
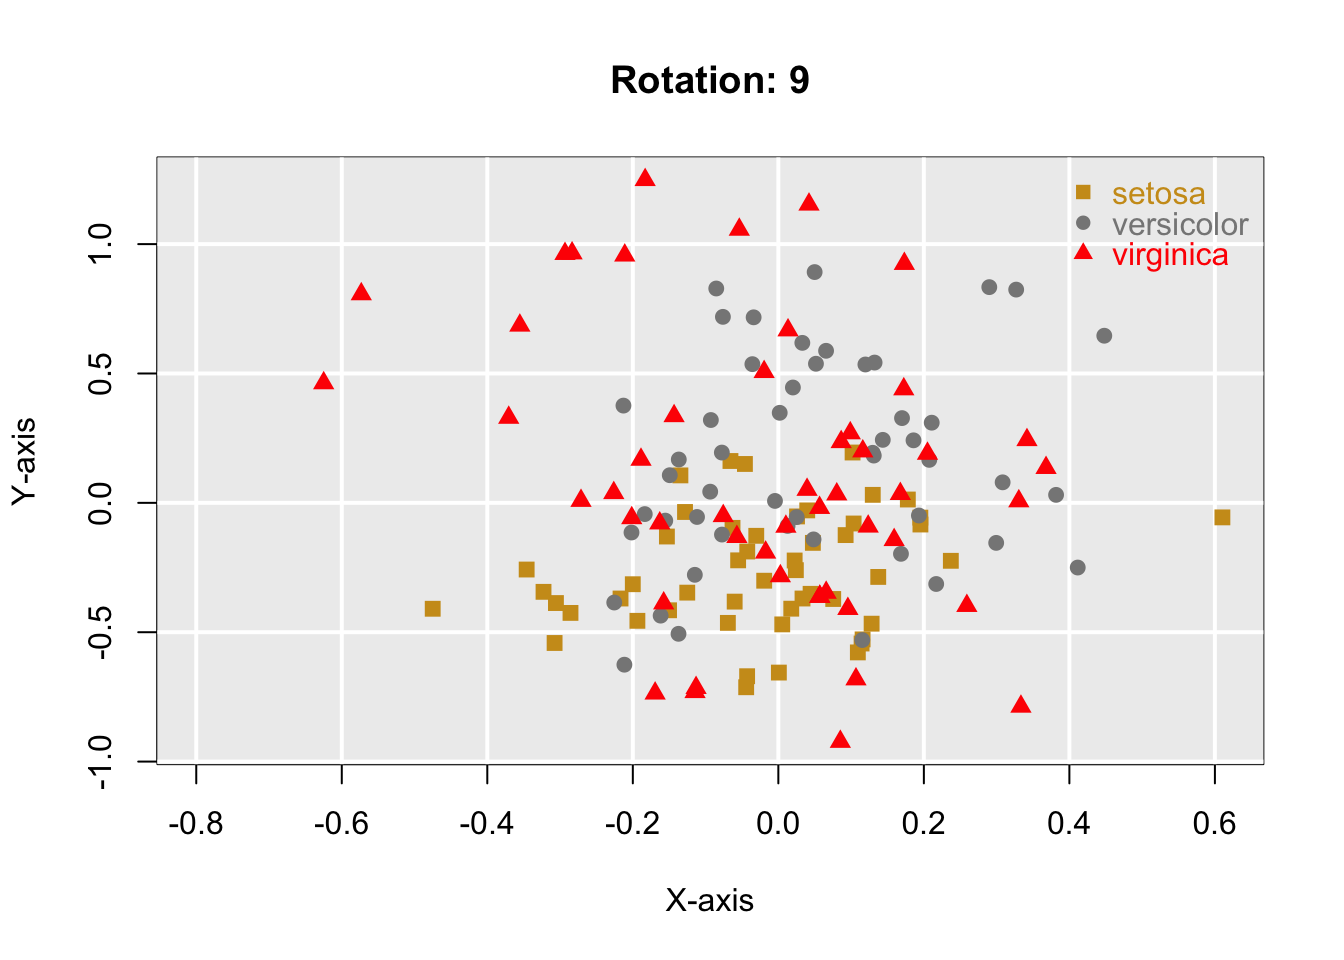
An Package for projection pursuit (PP) with 17 methods and Grand Tour (Asimov 1985) with 3 methods. Being that projection pursuit searches for low-dimensional linear projections in highdimensional data structures, while grand tour is a technique used to explore multivariate statistical data through animation.
## To cite package 'Pursuit' in publications use:
##
##   Ossani P, Cirillo M (2026). _Pursuit: Projection Pursuit_. doi:10.32614/CRAN.package.Pursuit
##   <https://doi.org/10.32614/CRAN.package.Pursuit>. R package version 1.1.0,
##   <https://CRAN.R-project.org/package=Pursuit>.
##
## A BibTeX entry for LaTeX users is
##
##   @Manual{,
##     title = {Pursuit: Projection Pursuit},
##     author = {Paulo Cesar Ossani and Marcelo Angelo Cirillo},
##     year = {2026},
##     note = {R package version 1.1.0},
##     url = {https://CRAN.R-project.org/package=Pursuit},
##     doi = {10.32614/CRAN.package.Pursuit},
## }library(Pursuit)
data(iris) # database
res <- GrandTour(iris[,1:4], method = "Torus", title = NA, xlabel = NA, ylabel = NA,
color = TRUE, linlab = NA, class = NA, posleg = 2, boxleg = TRUE,
axesvar = TRUE, axes = FALSE, numrot = 10, choicerot = NA,
savptc = FALSE, width = 3236, height = 2000, res = 300)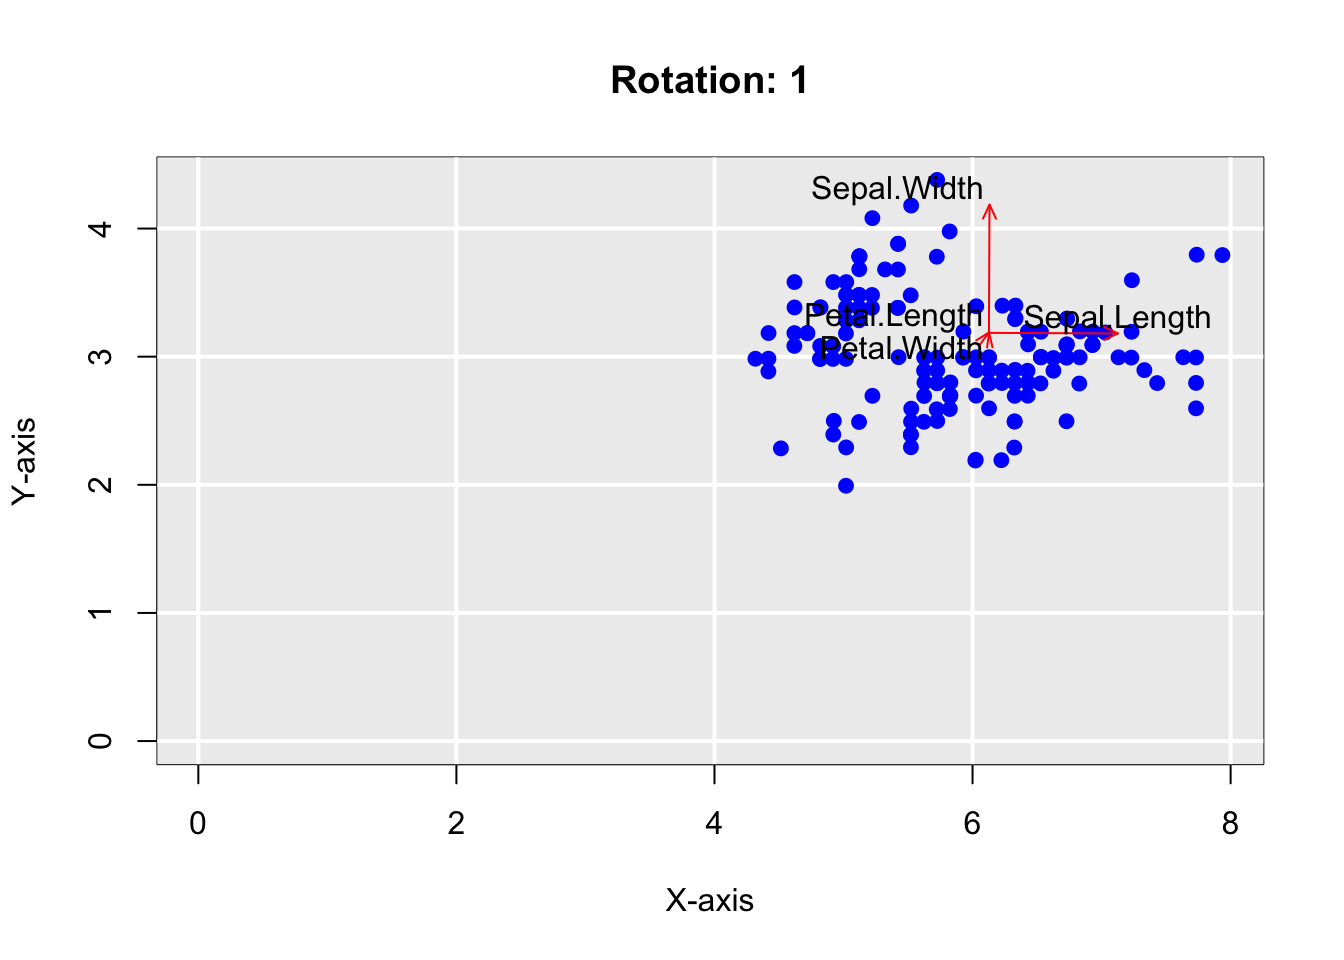


# print("Projected data:"); res$proj.data
# print("Projection vectors:"); res$vector.opt
# print("Grand Tour projection method:"); res$method
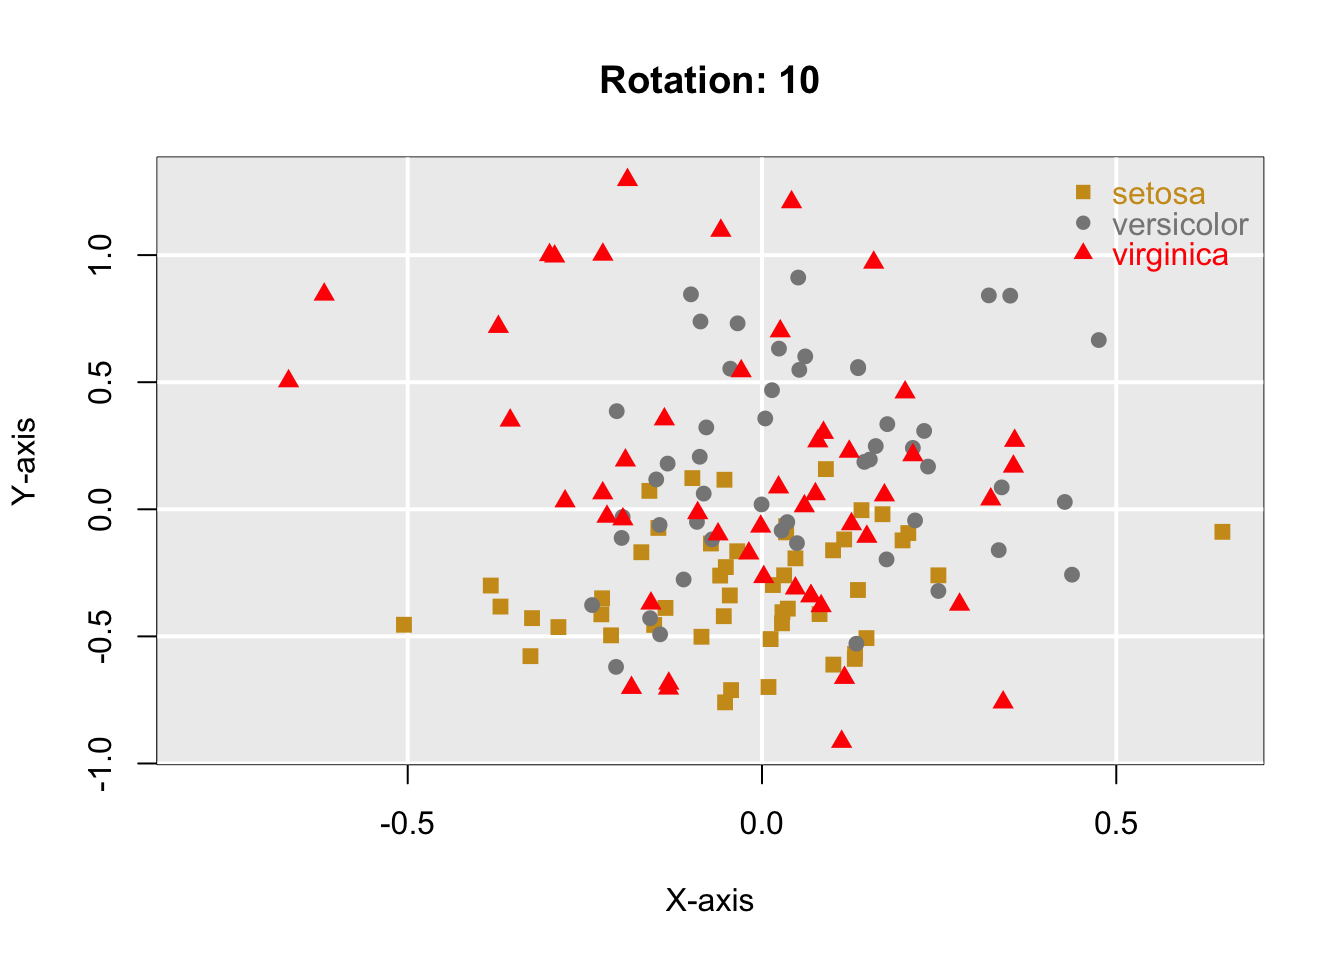
res <- GrandTour(iris[,1:4], method = "Interpolation", title = NA, xlabel = NA, ylabel = NA,
color = TRUE, linlab = NA, posleg = 2, boxleg = FALSE, axesvar = FALSE,
axes = FALSE, numrot = 10, choicerot = NA, class = iris[,5],
classcolor = c("goldenrod3","gray53","red"),savptc = FALSE,
width = 3236, height = 2000, res = 300)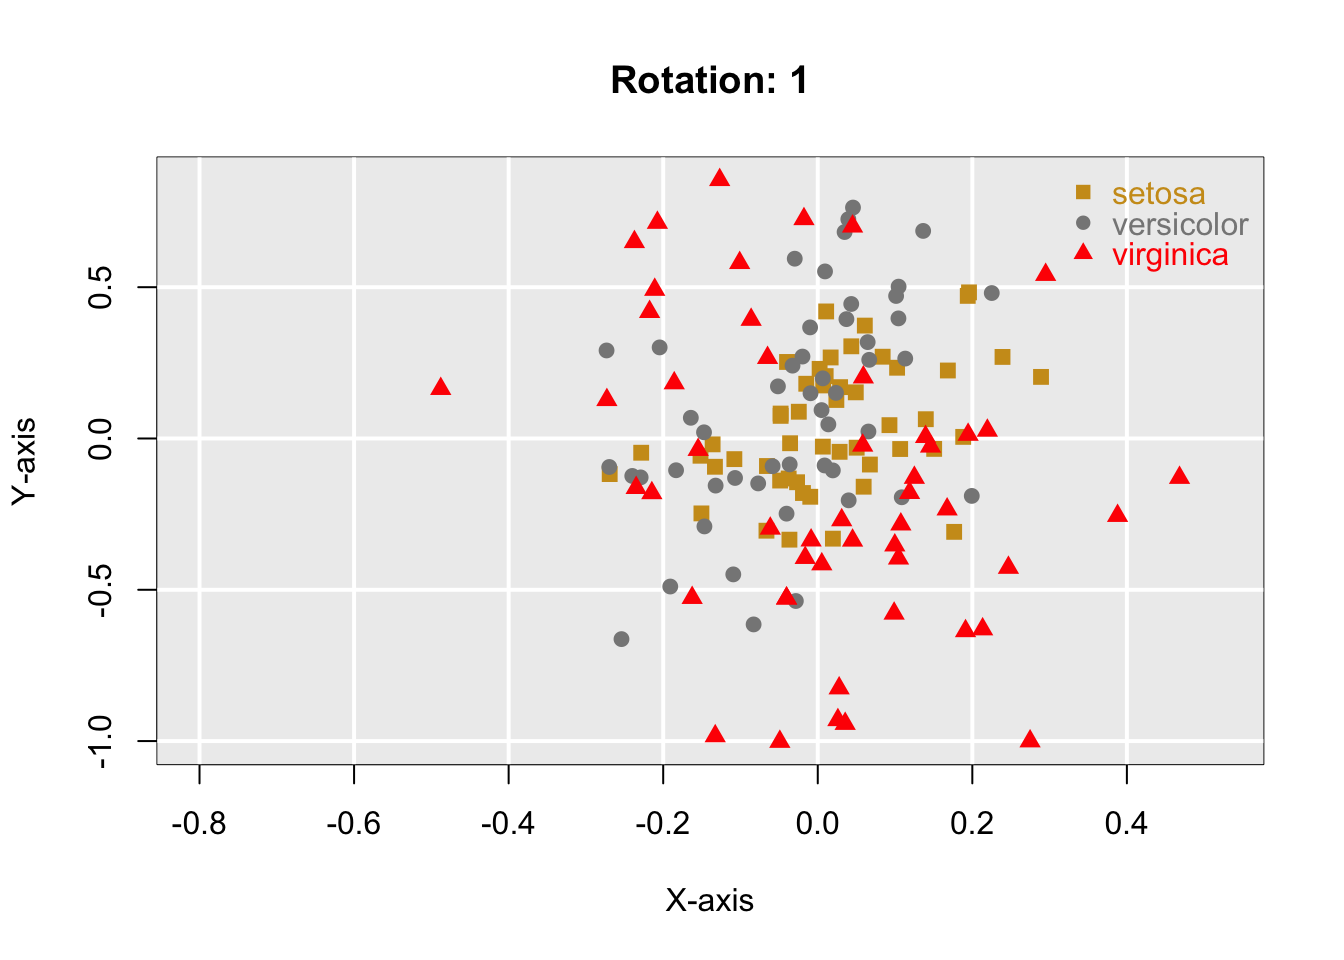
# print("Projected data:"); res$proj.data
# print("Projection vectors:"); res$vector.opt
# print("Grand Tour projection method:"); res$method(Lee 2018)
## To cite PPtreeViz in publications use:
##
##   Lee E (2018). "PPtreeViz: An R Package for Visualizing Projection Pursuit Classification
##   Trees." _Journal of Statistical Software_, *83*(8), 1-30. doi:10.18637/jss.v083.i08
##   <https://doi.org/10.18637/jss.v083.i08>.
##
## A BibTeX entry for LaTeX users is
##
##   @Article{,
##     title = {{PPtreeViz}: An {R} Package for Visualizing Projection Pursuit Classification Trees},
##     author = {Eun-Kyung Lee},
##     journal = {Journal of Statistical Software},
##     year = {2018},
##     volume = {83},
##     number = {8},
##     pages = {1--30},
##     doi = {10.18637/jss.v083.i08},
##   }
Exercício 8.4 Veja a documentação de
a. Pursuit.
b. PPtreeViz.