5.6 … para proporções
5.6.1 Beta \(\cdot\) \(Beta(\alpha,\beta)\)
5.6.2 Dirichlet \(\cdot\) \(Dir(\alpha_1,\ldots,\alpha_k)\)
\(0 \le x_i \le 1\), \(\alpha_i > 0\), \(i \in \{1,\ldots,k\}\). \[\begin{equation} f(x_1,\ldots,x_k|\alpha_1,\ldots,\alpha_k) = \frac{\Gamma(\sum_{i=1}^{k} \alpha_i)}{\prod _{i=1}^{k}\Gamma(\alpha_i)} \prod_{i=1}^{k} x_i^{\alpha_i-1} \tag{5.16} \end{equation}\]
\[\begin{equation} E(X_i) = \frac{\alpha_i}{\sum_{j=1}^{k} \alpha_j} \tag{5.17} \end{equation}\]
\[\begin{equation} V(X_i) = \frac{\frac{\alpha_i}{\sum_{j=1}^k \alpha_j} \left( 1- \frac{\alpha_i}{\sum_{j=1}^k \alpha_j} \right)}{\sum_{j=1}^k \alpha_j + 1} \tag{5.18} \end{equation}\]
\[\begin{equation} Mo() ... \tag{5.19} \end{equation}\]
5.6.2.1 Gráficos
# Opção 1
library(Compositional)
draw <- extraDistr::rdirichlet(2000, c(20,10,5))
bivt.contour(draw, appear = FALSE)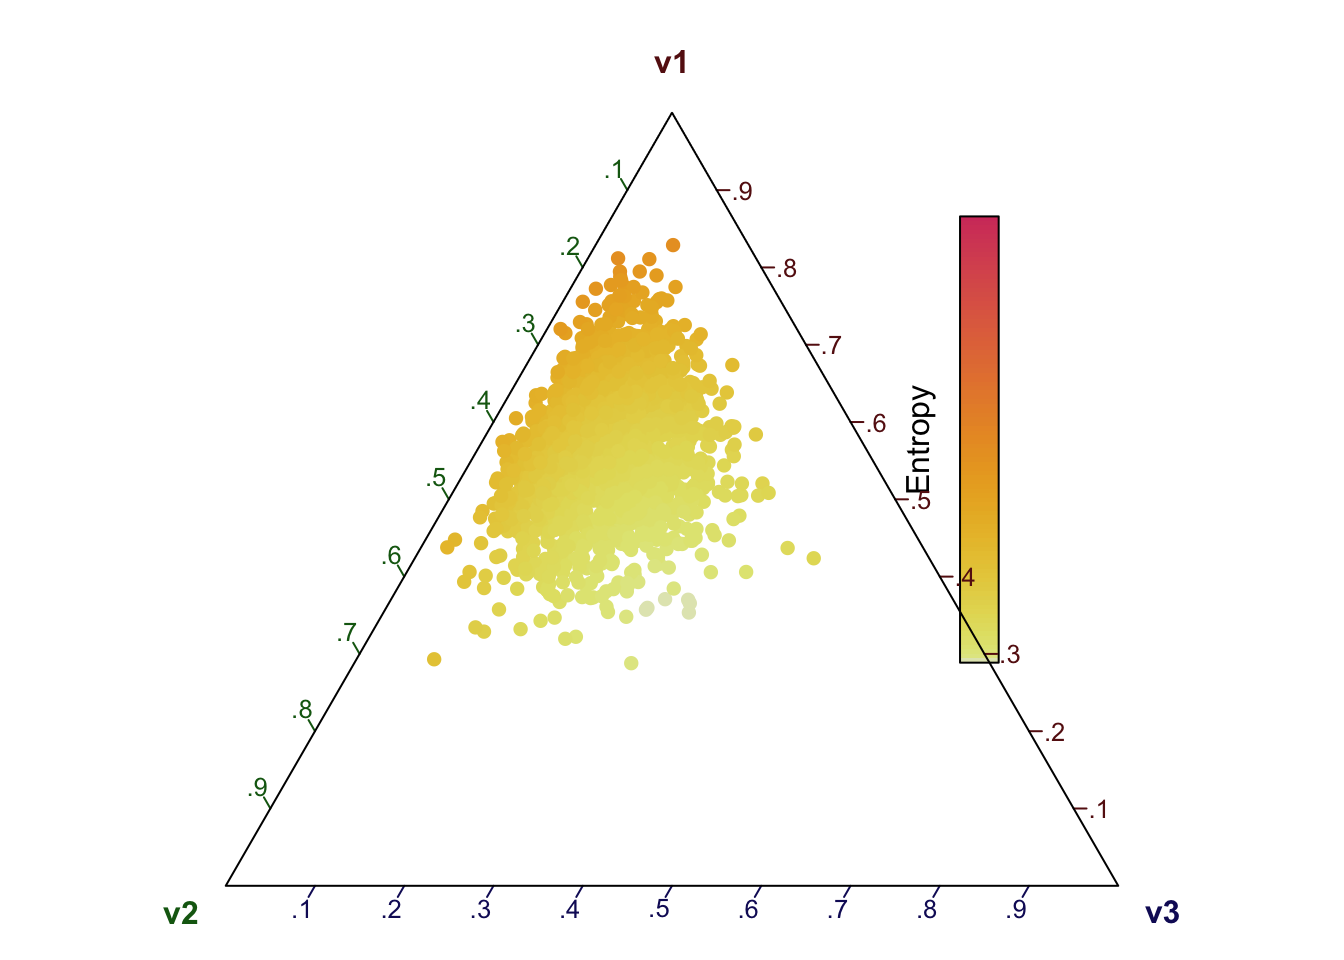
# Opção 2
library(gtools)
library(DirichletReg)

dat <- extraDistr::rdirichlet(2000, alpha = c(20,10,5))
plot(DR_data(dat),
     a2d = list(colored = TRUE,
                c.grid = FALSE,
                col.scheme = c("entropy")))
# Opção 3
library(dirichlet)
library(dplyr)
library(ggplot2)
theme_set(theme_bw())

f <- function(v) ddirichlet(v, c(20,10,15))
mesh <- simplex_mesh(.0025) %>% as.data.frame %>% as_tibble
mesh$f <- mesh %>% apply(1, function(v) f(bary2simp(v)))

(p <- ggplot(mesh, aes(x, y)) +
  geom_raster(aes(fill = f)) +
  coord_equal(xlim = c(0,1), ylim = c(0, .85)))
tam <- 26
pac <- pbc <- pcc <- seq(0,1,length=tam)

# Criando o vetor 'rr' que copia length(pbc) vezes cada ponto de 'pac'
rr <- vector()
j <- 1
for(i in 1:tam^2){
  if(i>1 & i %% tam == 1) {j <- j + 1}
  rr[i] <- pac[j]
}

# Criando a matriz 'ptc' que combina todos as ternas (rr, pbc, 1-rr-pbc)
ptc <- cbind(rr, pbc, 1-rr-pbc)

# Criando a matriz 'nptc', que conterá apenas as ternas de 'ptc' cuja soma é igual a 1
j <- 0
nptc <- matrix(0 , nrow=dim(ptc)[1], ncol=dim(ptc)[2])
for(i in 1:dim(ptc)[1]){
  if(ptc[i,3]>0){
    j <- j + 1
    nptc[j,1] <- ptc[i,1]
    nptc[j,2] <- ptc[i,2]
    nptc[j,3] <- ptc[i,3]
  }
}

# Contando quantos pares de 'nptc' são 'NA'
cont <- 0
for(i in 1:dim(nptc)[1]){
  if(is.na(nptc[i,1]) == TRUE) {cont <- cont+1}
}

# Atribuindo 'nptc' a 'simplex' apenas com os valores não 'NA'
if(type_book == 'bookdown::gitbook'){
  simplex <- nptc[1:(dim(nptc)[1] - cont), ]
  colnames(simplex) <- c('theta1', 'theta2', 'theta3')
  rgl::plot3d(simplex, col = 'red')
}

draws <- extraDistr::rdirichlet(2000, alpha = c(20,10,15))
if(type_book == 'bookdown::gitbook'){
  rgl::plot3d(draws, xlim = c(0,1), ylim = c(0,1), zlim = c(0,1), add =  TRUE)
}