11.9 Modelos ARMA
O pacote forecast (Rob J. Hyndman and Khandakar 2008) apresenta métodos e ferramentas para exibir e analisar previsões de séries temporais univariadas, incluindo modelagem ARIMA automática, redes neurais feed-forward e suavização exponencial via modelos de espaço de estado. O pacote fable (O’Hara-Wild, Hyndman, and Wang 2024) implementa muitos dos mesmos modelos em estrutura tidyverse.
AutoTS (C. Wang et al. 2022) é um pacote de séries temporais para Python projetado para implementar previsões com potencial ganho de escala.
11.9.1 ARIMA
The stochastic model for which the exponentially weighted moving average forecast is optimal is a member of a class of nonstationary processes called autoregressive-integrated moving average processes (ARIMA). (G. E. P. Box and Jenkins 1970, 8)
One extension to the ARMA class of processes which greatly enhances their value as empirical descriptors of non-stationary time series is the class of autoregressive integrated moving average, or ARIMA, processes. (Diggle 1990, 165)
ARIMA é o acrônimo para AutoRegressive Integrated Moving Average, o modelo Auto Regressivo Integrado de Média Móvel.
11.9.1.1 AR
Seguindo (G. E. P. Box and Jenkins 1970, 9), \[\begin{equation} \tilde{y}_{t} = \phi_1 \tilde{y}_{t-1} + \cdots + \phi_p \tilde{y}_{t-p} + a_t \tag{11.15} \end{equation}\] é um processo autorregressivo (AR) de ordem \(p\), onde \(\tilde{y}_{t} = {y}_{t} - \mu\) e \(a_t\) é um ruído branco com média zero e variância \(\sigma^2_a\), indicado por \(a_t \sim WN(0,\sigma^2_a)\). O modelo contém \(p+2\) parâmetros desconhecidos \(\mu, \phi_1, \phi_2, \ldots, \phi_p, \sigma^2_a\) que podem ser estimados a partir dos dados. Se um operador autorregressivo (ou lag polynomial) de ordem \(p\) é defindo por \[\begin{equation} \phi(B) = 1 - \phi_1 B - \phi_2 B^2 - \cdots - \phi_p B^p \tag{11.16} \end{equation}\] o modelo AR da Eq. (11.15) pode ser escrito como \[\begin{equation} \phi(B) \tilde{y}_{t} = a_t \tag{11.17} \end{equation}\]
11.9.1.2 MA
(G. E. P. Box and Jenkins 1970, 10) definem \[\begin{equation} \tilde{y}_{t} = a_t - \theta_1 a_{t-1} - \theta_2 a_{t-2} - \cdots - \theta_q a_{t-q} \tag{11.18} \end{equation}\] como um processo de médias móveis (MA) de ordem \(q\). O modelo contém \(q+2\) parâmetros desconhecidos \(\mu, \theta_1, \ldots, \theta_q, \sigma^2_a\) que podem ser estimados a partir dos dados. Note que os pesos \(1, - \theta_1, \ldots, - \theta_q\) não precisam ser positivos ou somar 1. Se um operador de médias móveis de ordem \(q\) é defindo por \[\begin{equation} \theta(B) = 1 - \theta_1 B - \theta_2 B^2 - \cdots - \theta_q B^q \tag{11.19} \end{equation}\] o modelo MA da Eq. (11.18) pode ser escrito como \[\begin{equation} \tilde{y}_{t} = \theta(B) a_t \tag{11.17} \end{equation}\]
11.9.1.3 AR(I)MA
(G. E. P. Box and Jenkins 1970, 11) indicam que um modelo ARMA (misto autorregresivo de médias móveis) pode ser escrito \[\begin{equation} \tilde{y}_{t} = \phi_1 \tilde{y}_{t-1} + \cdots + \phi_p \tilde{y}_{t-p} + a_t - \theta_1 a_{t-1} - \theta_2 a_{t-2} - \cdots - \theta_q a_{t-q} \tag{11.20} \end{equation}\] ou \[\begin{equation} \phi(B)\tilde{y}_{t} = \theta(B)a_t \tag{11.21} \end{equation}\] que possui \(p+q+2\) parâmetros \(\mu, \; \phi_1, \ldots, \phi_p, \; \theta_1, \ldots, \theta_q, \; \sigma^2_a\)
(G. E. P. Box and Jenkins 1970, 11) definem o operador autorregressivo generalizado \(\varphi(B)\) tal que \[\begin{equation} \varphi(B) = \phi(B)(1-B)^d \tag{11.22} \end{equation}\] onde \(\phi(B)\) é o operador estacionário. Desta forma um processo ARIMA de ordem \(p,d,q\) usando o operador backshift pode ser escrito na forma \[\begin{equation} \varphi(B)y_t = \phi(B)(1-B)^d y_t = c + \theta(B)a_t \tag{11.23} \end{equation}\] onde \[\begin{equation} \phi(B) = 1 - \phi_1 B - \phi_2 B^2 - \cdots - \phi_p B^p \tag{11.24} \end{equation}\] \[\begin{equation} \theta(B) = 1 - \theta_1 B - \theta_2 B^2 - \cdots - \theta_q B^q \tag{11.25} \end{equation}\]
(Diggle 1990, 165) aponta que \(\phi(\cdot)\) e \(\theta(\cdot)\) são polinômios de graus \(p\) e \(q\) respectivamente e com todas as raízes das equações polinomiais \(\phi(z)=0\) e \(\theta(z)=0\) fora do círculo unitário.
Exercício 11.20 Leituras recomendadas.
- Veja a discussão sobre a prova de que as raízes fora do círculo unitário garantem a estacionariedade da série temporal em https://quant.stackexchange.com/questions/65766/proof-of-the-fact-that-roots-lie-outside-the-unit-circle-guarantee-stationarity.
- https://otexts.com/fpp3/MA.html
- https://stats.stackexchange.com/questions/26024/moving-average-model-error-terms
- Polinômio característico
- Passeio aleatório
Exercício 11.21 Escreva em notação backshift.
- ARIMA(0,0,0)
- ARIMA(1,0,0)
- ARIMA(0,0,1)
- ARIMA(0,1,0)
- ARIMA(1,0,1)
- ARIMA(1,1,1)
- ARIMA(2,2,2)
11.9.1.4 Método Box & Jenkins
A estimação dos parâmetros \(p,d,q\) pode ser realizada de diversas formas. O método de Box & Jenkins (G. E. P. Box and Jenkins 1970) é uma abordagem bastante discutida na literatura. O artigo Rob Hyndman (2001-05-25) Box-Jenkins modelling faz um breve resumo do método. (Enders 2014, 61) fornece padrões teóricos de ACF e PACF para alguns exemplos de modelos ARMA.

# ARIMA(1,0,0), \phi_1 = 0.7
par(mfrow=c(1,2))
set.seed(1); ar1 <- arima.sim(list(ar = 0.7), n = 200)
acf(ar1)
pacf(ar1)
# ARIMA(1,0,0), \phi_1 = -0.7
par(mfrow=c(1,2))
set.seed(2); ar1n <- arima.sim(list(ar = -0.7), n = 200)
acf(ar1n)
pacf(ar1n)
# ARIMA(0,0,1), \theta_1 = 0.7
par(mfrow=c(1,2))
set.seed(3); ma1n <- arima.sim(list(ma = 0.7), n = 200)
acf(ma1n)
pacf(ma1n)
# ARIMA(2,0,0), \phi_1 = 0.7, \phi_2 = -0.49
par(mfrow=c(1,2))
set.seed(4); ar2 <- arima.sim(list(ar = c(0.7,-0.49)), n = 200)
acf(ar2)
pacf(ar2)
11.9.1.5 forecast::auto.arima
forecast::auto.arima (R. Hyndman, Athanasopoulos, et al. 2024) retorna o melhor modelo ARIMA de acordo com o valor AIC, AICc ou BIC. Baseada em (Rob J. Hyndman and Khandakar 2008), a função realiza uma busca sobre o modelo possível dentro das restrições de ordem fornecidas.
## Series: z
## ARIMA(0,0,0) with zero mean
##
## sigma^2 = 1.075:  log likelihood = -145.49
## AIC=292.99   AICc=293.03   BIC=295.59
\[y_t = a_t\] \[a_t \sim N(0,1.075)\]
## Series: lh
## ARIMA(1,0,0) with non-zero mean
##
## Coefficients:
##          ar1    mean
##       0.5739  2.4133
## s.e.  0.1161  0.1466
##
## sigma^2 = 0.2061:  log likelihood = -29.38
## AIC=64.76   AICc=65.3   BIC=70.37
\[y_t = 2.4133 + 0.5739 y_{t-1} + a_t\] \[a_t \sim N(0,0.2061)\]


Gráfico com previsão 10 passos à frente.

Exercício 11.22 Considere as simulações da Seção 11.9.1.4.
- Ajuste modelos ARIMA automáticos, analisando os resíduos de cada modelo.
- Descreva a equação de cada modelo, na forma expandida e utilizando o operador backshift.
- Faça a projeção 10 passos adiante.
11.9.2 SARIMA
O modelo SARIMA\((p,d,q)(P,D,Q)_m\) pode ser descrito na forma geral
\[\begin{equation} \phi(B) \Phi(B) (1-B)^d (1-B^m)^D y_t = c + \theta(B) \Theta(B) a_t \tag{11.26} \end{equation}\] onde \(\phi(B)\) é dado pela Eq. (11.24), \(\theta(B)\) pela Eq. (11.25) e \[\begin{equation} \Phi(B) = 1 - \Phi_1 B^{m} - \Phi_2 B^{2m} - \cdots - \Phi_P B^{Pm} \tag{11.27} \end{equation}\] \[\begin{equation} \Theta(B) = 1 - \Theta_1 B^{m} - \Theta_2 B^{2m} - \cdots - \Theta_Q B^{Qm} \tag{11.28} \end{equation}\]
Exercício 11.23 Veja
Exemplo 11.41 O modelo SARIMA pode ser obtido por forecast::auto.arima() (R. Hyndman, Athanasopoulos, et al. 2024). Considere novamente a base mensal de corticosteroide.


# série da primeira diferença sazonal lag 12
acf(diff(h02, lag = 12), lag.max = 48)
pacf(diff(h02, lag = 12), lag.max = 48)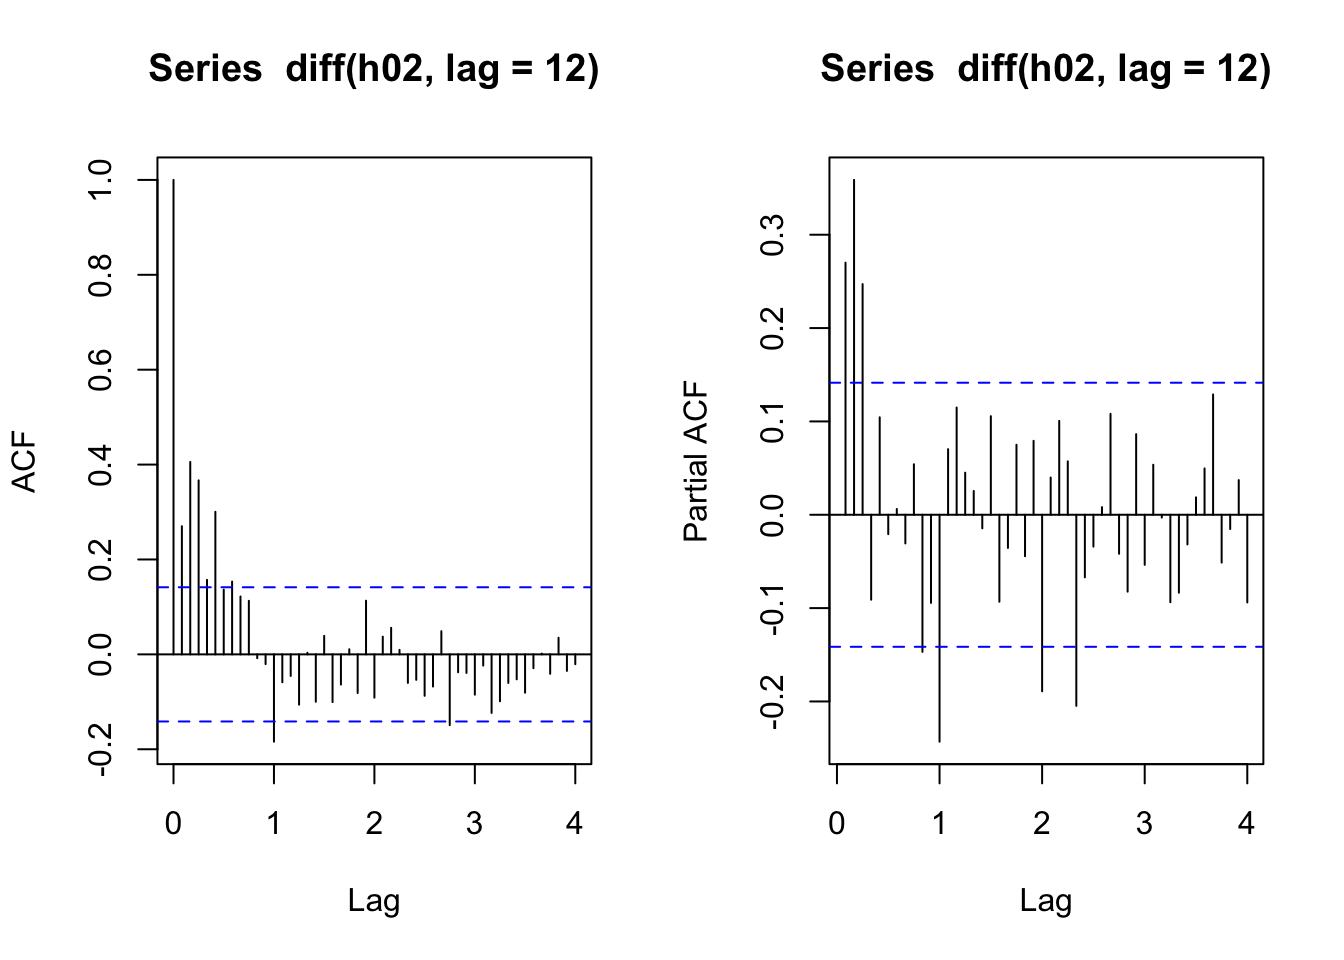
## Series: h02
## ARIMA(4,1,1)(0,1,2)[12]
##
## Coefficients:
##          ar1     ar2     ar3      ar4      ma1     sma1     sma2
##       0.0888  0.3386  0.2302  -0.2233  -0.9068  -0.4798  -0.1624
## s.e.  0.1063  0.0976  0.0894   0.0850   0.0853   0.0913   0.0930
##
## sigma^2 = 0.00276:  log likelihood = 291.7
## AIC=-567.4   AICc=-566.6   BIC=-541.38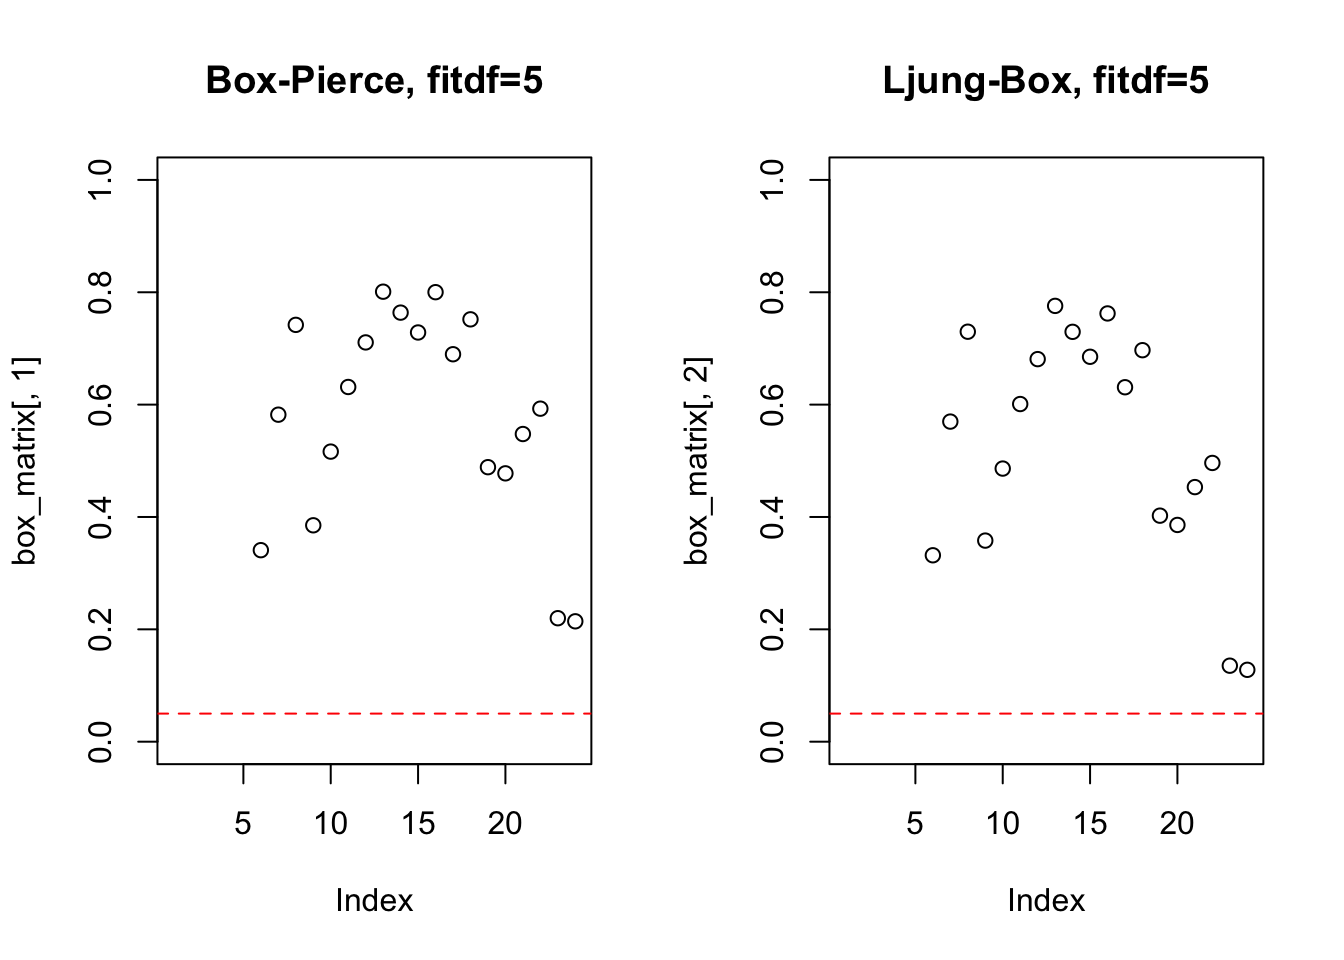
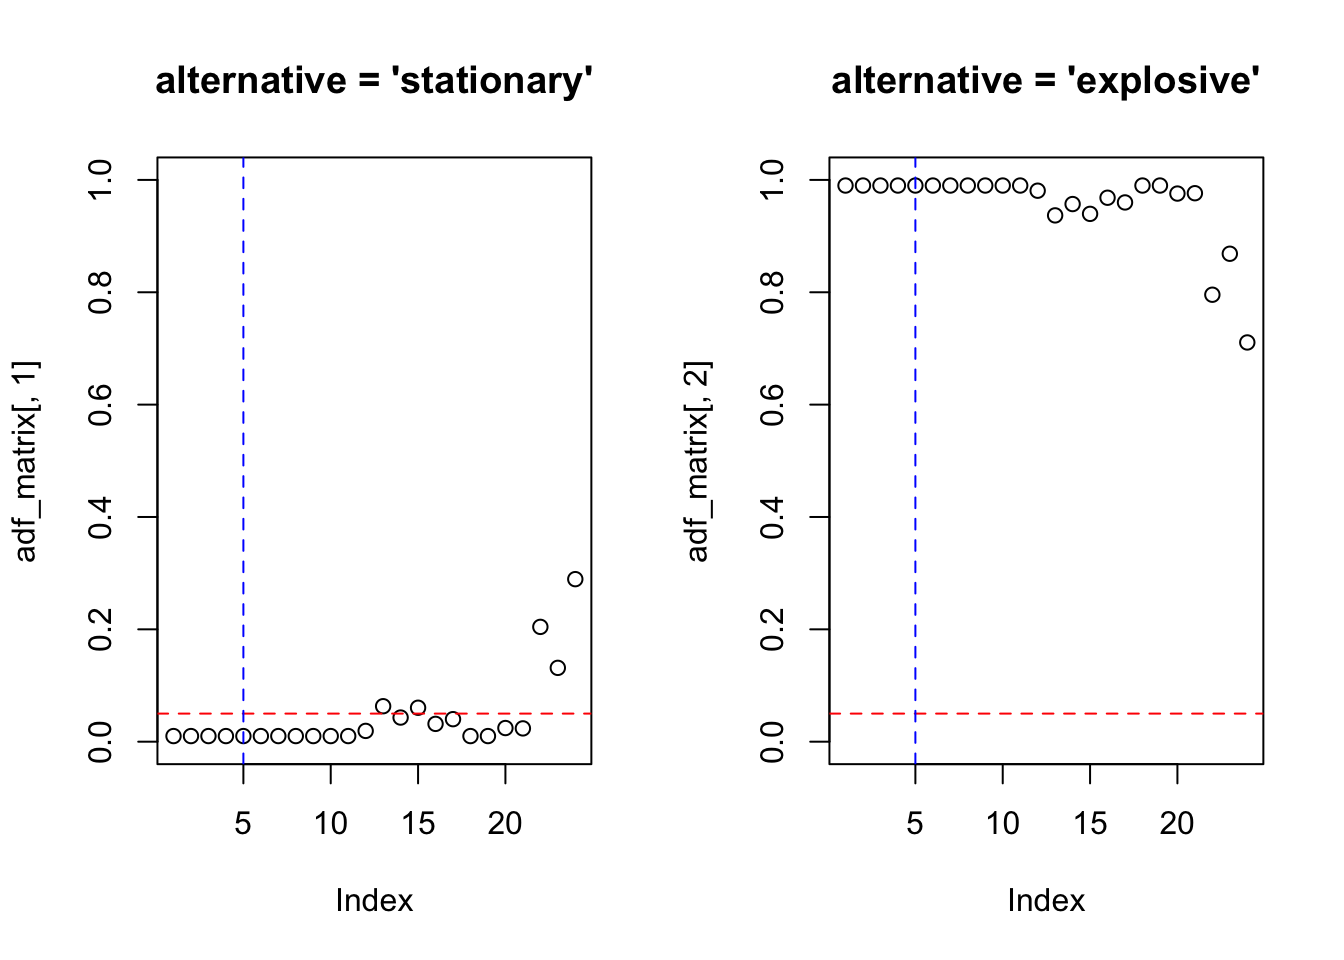
A função bayesforecast::auto.sarima() (Matamoros and Torres 2020) obtém automaticamente o modelo ARIMA implementado por (Rob J. Hyndman and Khandakar 2008) usando o menor BIC (Eq. (9.22)), procedendo ao ajuste do modelo usando a função varstan() e os priors padrão de um construtor de modelo Sarima. Para melhor ajuste e seleção do modelo, são testados diferentes modelos e critérios de seleção, como bayesforecast::loo() (Leave-one-out cross-validation) ou bayesforecast::bayes_factor().
Exemplo 11.42 Adaptado da documentação de bayesforecast::auto.sarima().
##
## SAMPLING FOR MODEL 'Sarima' NOW (CHAIN 1).
## Chain 1:
## Chain 1: Gradient evaluation took 0.00137 seconds
## Chain 1: 1000 transitions using 10 leapfrog steps per transition would take 13.7 seconds.
## Chain 1: Adjust your expectations accordingly!
## Chain 1:
## Chain 1:
## Chain 1: Iteration:   1 / 500 [  0%]  (Warmup)
## Chain 1: Iteration:  50 / 500 [ 10%]  (Warmup)
## Chain 1: Iteration: 100 / 500 [ 20%]  (Warmup)
## Chain 1: Iteration: 150 / 500 [ 30%]  (Warmup)
## Chain 1: Iteration: 200 / 500 [ 40%]  (Warmup)
## Chain 1: Iteration: 250 / 500 [ 50%]  (Warmup)
## Chain 1: Iteration: 251 / 500 [ 50%]  (Sampling)
## Chain 1: Iteration: 300 / 500 [ 60%]  (Sampling)
## Chain 1: Iteration: 350 / 500 [ 70%]  (Sampling)
## Chain 1: Iteration: 400 / 500 [ 80%]  (Sampling)
## Chain 1: Iteration: 450 / 500 [ 90%]  (Sampling)
## Chain 1: Iteration: 500 / 500 [100%]  (Sampling)
## Chain 1:
## Chain 1:  Elapsed Time: 1.297 seconds (Warm-up)
## Chain 1:                0.288 seconds (Sampling)
## Chain 1:                1.585 seconds (Total)
## Chain 1:
##
## y ~ Sarima(0,1,1)(0,1,1)[12]
## 204 observations and 1 dimension
## Differences: 1 seasonal Differences: 1
## Current observations: 191
##
## mean se 5% 95% ess Rhat
## mu0 -0.0002 0.0000 -0.0009 0.0005 227.7366 1.0000
## sigma0 0.0591 0.0002 0.0536 0.0654 211.9541 1.0027
## ma -0.7337 0.0036 -0.8249 -0.6409 206.0605 0.9967
## sma -0.2120 0.0031 -0.3037 -0.1291 248.3923 1.0002
## loglik 269.6529 0.1226 266.0451 272.4219 234.3392 0.9971
##
## Samples were drawn using sampling(NUTS). For each parameter, ess
## is the effective sample size, and Rhat is the potential
## scale reduction factor on split chains (at convergence, Rhat = 1).11.9.3 ARMAX
The acronym ARMAX stands for autoregressive-moving average with exogenous variables. (Hannan, Dunsmuir, and Deistler 1980, 276)
An ARMAX model simply adds in the covariate on the right hand side [of an ARMA\((p,q)\) model]. (Rob J. Hyndman 2010)
Seguindo (Rob J. Hyndman 2010), o modelo ARMAX pode ser descrito em função de \(y_t\) na forma
\[\begin{equation} y_t = \beta x_t + \phi_1 y_{t-1} + \cdots + \phi_p y_{t-p} + a_t - \theta_1 a_{t-1} - \cdots - \theta_q a_{t-q} \tag{11.29} \end{equation}\]
onde \(x_t\) é uma covariável no tempo \(t\), \(\beta\) é seu coeficiente e \(a_t \sim WN(0,\sigma^2_a)\). Note que o valor de \(\beta\) não é o efeito em \(y_t\) quando o \(x_t\) é aumentado em 1, como na regressão. A presença de valores defasados da variável de resposta no lado direito da equação significa que \(\beta\) só pode ser interpretado condicionalmente aos valores anteriores da variável de resposta \(y_t\), o que é pouco intuitivo.
Usando notação backshift o modelo ARMAX fica
\[\begin{equation} \phi(B)y_t = \beta x_t - \theta(B) a_t \;\;\;\; \text{ou} \;\;\;\; y_t = \frac{\beta}{\phi(B)}x_t - \frac{\theta(B)}{\phi(B)} a_t \tag{11.30} \end{equation}\]
Pode-se ainda escrever o modelo ARMAX como uma regressão com erros ARMA na forma \[\begin{equation} y_t = \beta x_t + n_t \\ n_t = \phi_1 n_{t-1} + \cdots + \phi_p n_{t-p} + a_t - \theta_1 a_{t-1} - \cdots - \theta_q a_{t-q} \tag{11.31} \end{equation}\]
Com a notação backshift temos \[\begin{equation} y_t = \beta x_t + \frac{\theta(B)}{\phi(B)}a_t \tag{11.32} \end{equation}\]
11.9.4 ARIMAX
ARIMA with eXplanatory variables. (Parnell 2021, 4)
A função forecast::Arima() (R. Hyndman, Athanasopoulos, et al. 2024) permite ajustar um modelo ARIMAX através da adição de
Exemplo 11.43 Baseado em (Parnell 2021, 7–12)
wheat <- read.csv('https://raw.githubusercontent.com/andrewcparnell/TSDA/main/data/wheat.csv')
plot(wheat$year, wheat$wheat, type = 'l')

## Series: wheat$wheat
## Regression with ARIMA(1,0,1) errors
##
## Coefficients:
##           ar1    ma1   intercept      xreg
##       -0.2100  1.000  -558900.85  291.6336
## s.e.   0.1504  0.056    64748.12   32.5852
##
## sigma^2 = 5317994:  log likelihood = -485.31
## AIC=980.61   AICc=981.89   BIC=990.46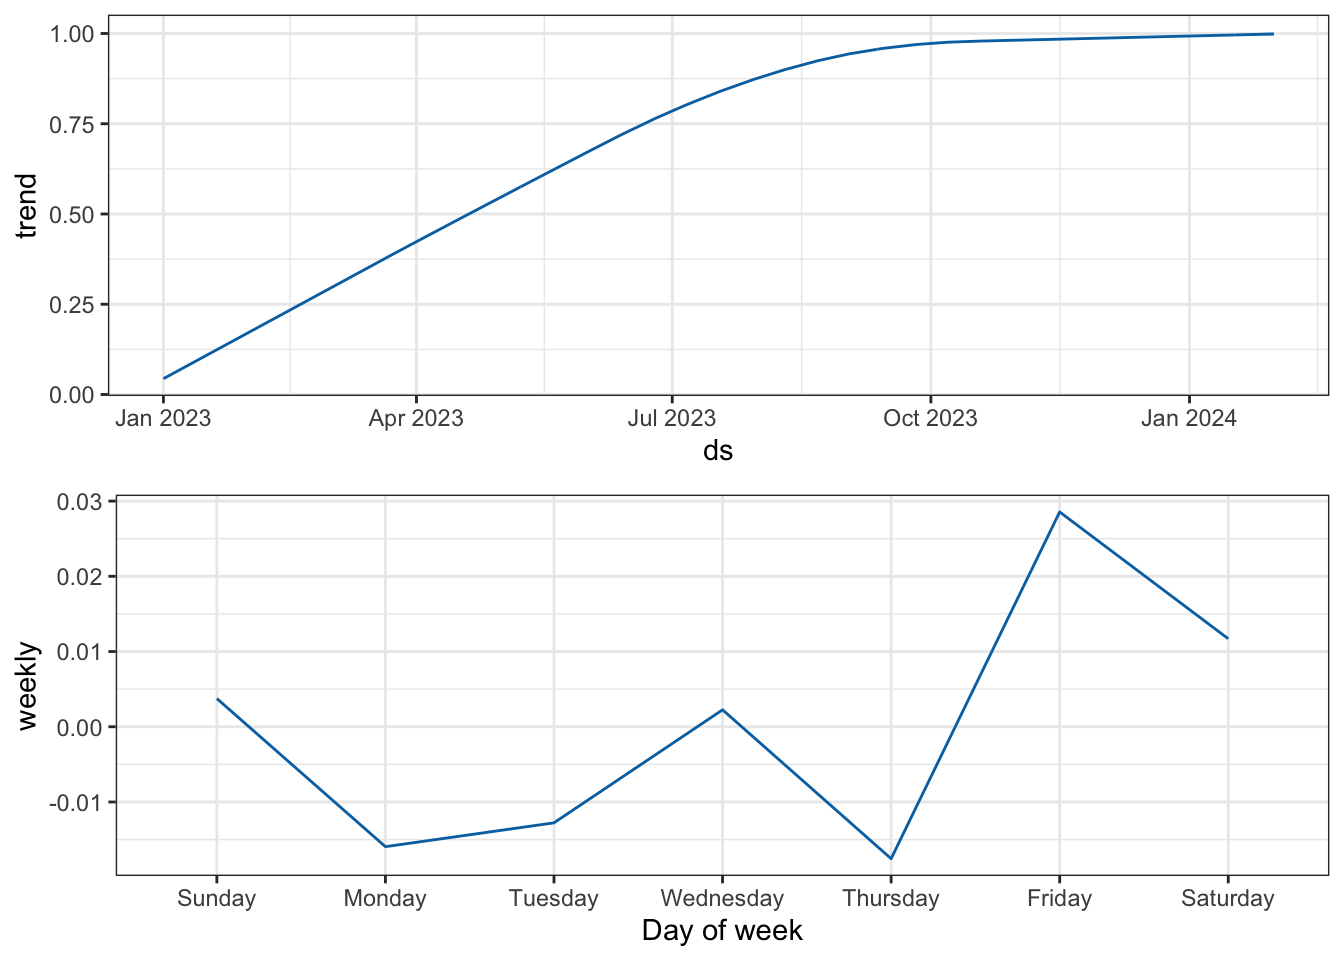

Pode-se também utilizar forecast::auto.arima() indicando a covariável através do argumento xreg.
## Series: wheat$wheat
## Regression with ARIMA(3,0,0) errors
##
## Coefficients:
##          ar1      ar2     ar3   intercept      xreg
##       0.5833  -0.4929  0.3077  -567234.43  295.8574
## s.e.  0.1577   0.1564  0.1570    74946.57   37.7317
##
## sigma^2 = 6388181:  log likelihood = -488.18
## AIC=988.35   AICc=990.18   BIC=1000.17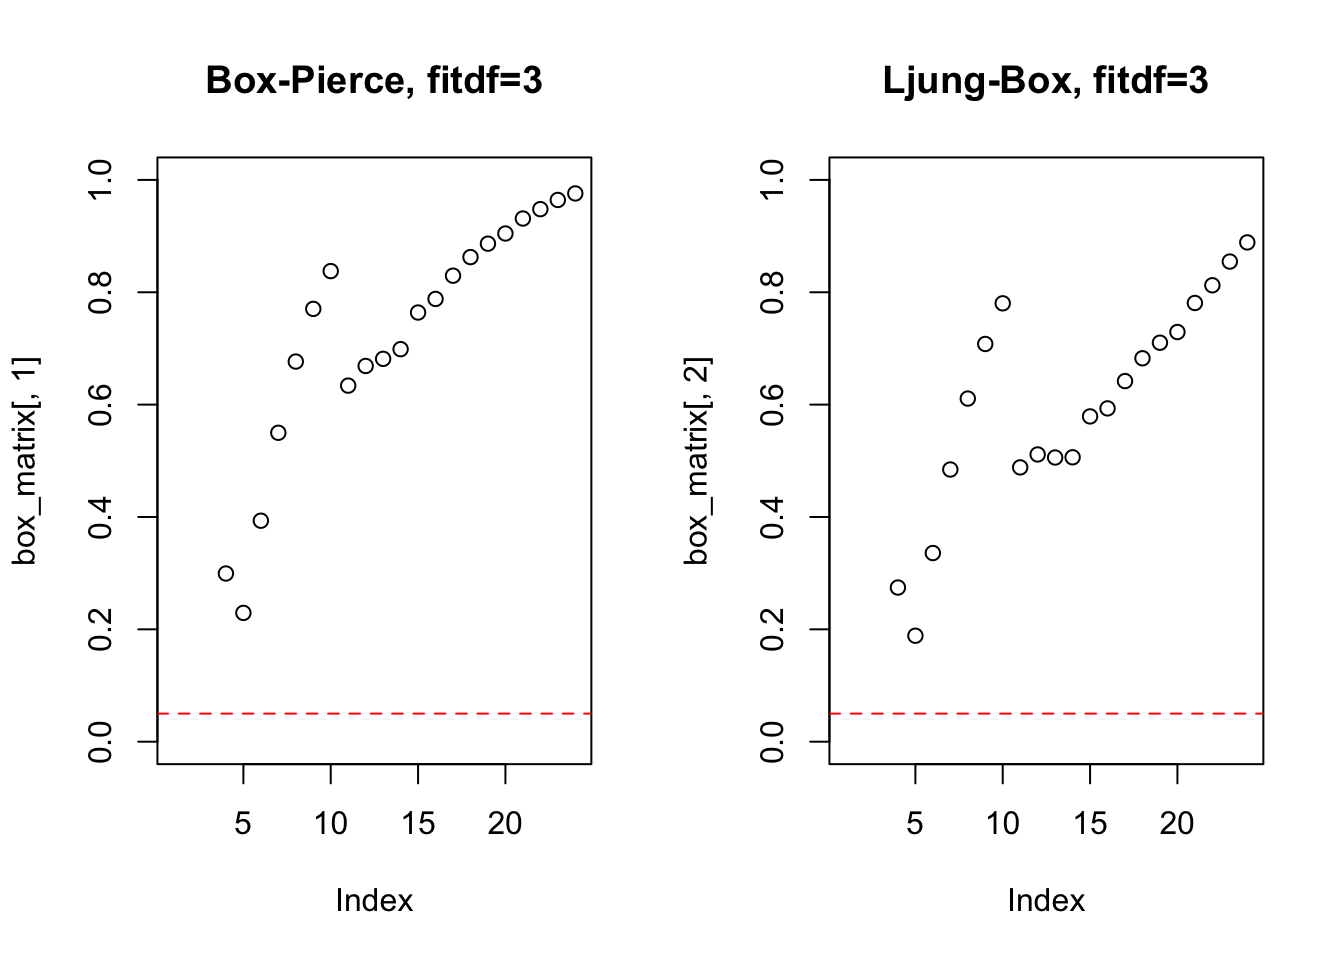
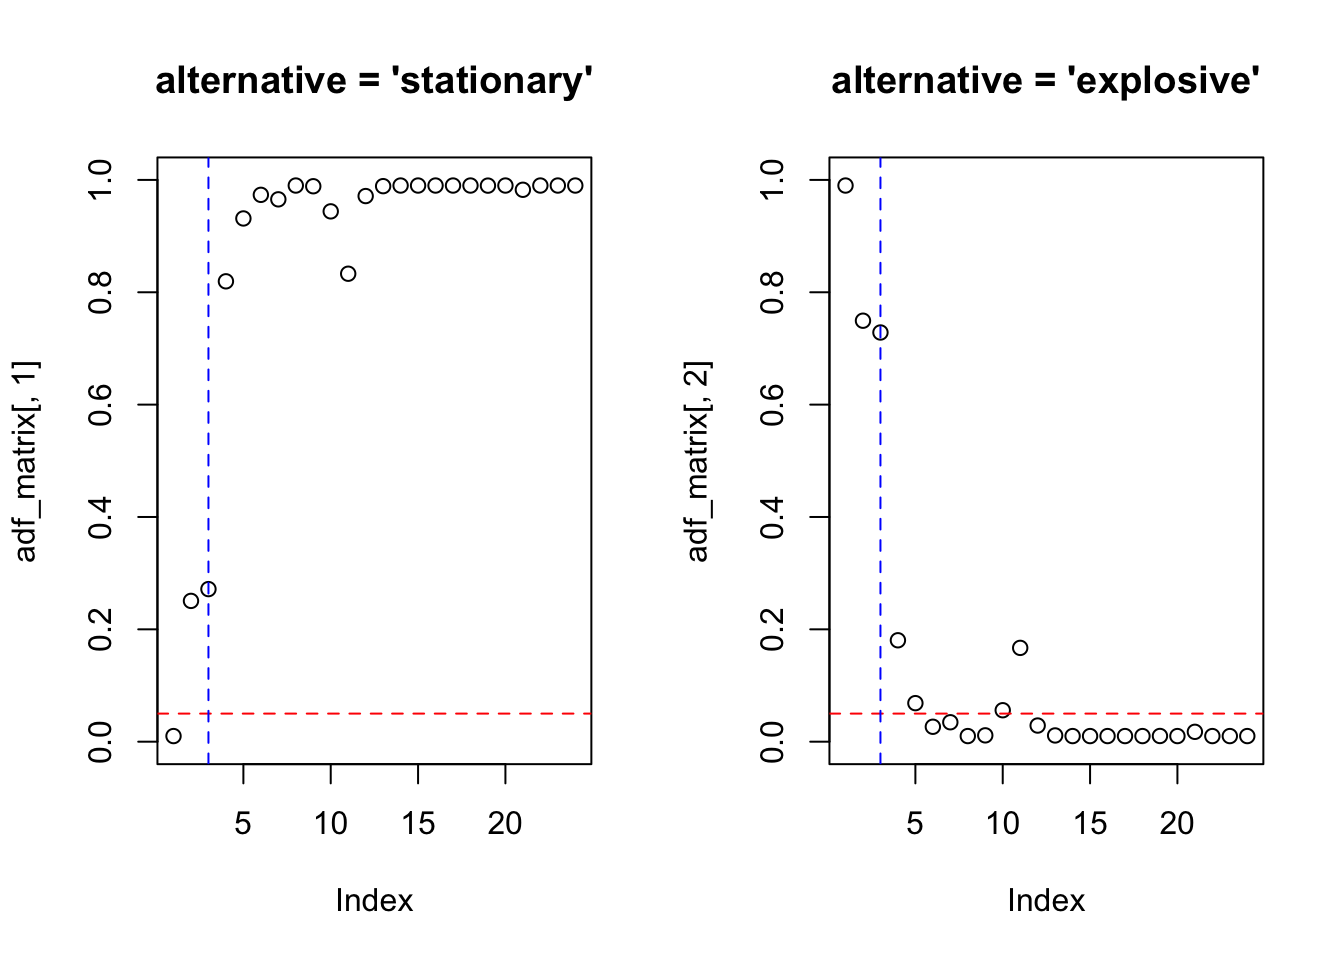
A função TSA::arimax() (Chan and Ripley 2022) amplia a capacidade da função `stats::arima() permitindo a incorporação de funções de transferência, outliers inovadores e aditivos.
Exemplo 11.44 Baseado na documentação de TSA::arimax().
library(TSA)
data(airmiles)
log_air <- log(airmiles)
autoplot(log_air, ylab = 'Log(airmiles)', xlab = 'Year', main = '')
diff_air <- diff(diff(window(log_air, end = c(2001,8)),12))
par(mfrow=c(2,1))
acf(diff_air, lag.max = 48)
pacf(diff_air, lag.max = 48)
air_m1 <- arimax(log_air, order = c(0,1,1), method = 'ML',
                 seasonal = list(order = c(0,1,1), period = 12),
                 xtransf = data.frame(I911 = 1*(seq(airmiles) == 69),
                                      I911 = 1*(seq(airmiles) == 69)),
                 transfer = list(c(0,0), c(1,0)),
                 xreg = data.frame(Dec96 = 1*(seq(airmiles) == 12),
                                   Jan97 = 1*(seq(airmiles) == 13),
                                   Dec02 = 1*(seq(airmiles) == 84)))
air_m1
##
## Call:
## arimax(x = log_air, order = c(0, 1, 1), seasonal = list(order = c(0, 1, 1),
## period = 12), xreg = data.frame(Dec96 = 1 * (seq(airmiles) == 12), Jan97 = 1 *
## (seq(airmiles) == 13), Dec02 = 1 * (seq(airmiles) == 84)), method = "ML",
## xtransf = data.frame(I911 = 1 * (seq(airmiles) == 69), I911 = 1 * (seq(airmiles) ==
## 69)), transfer = list(c(0, 0), c(1, 0)))
##
## Coefficients:
## ma1 sma1 Dec96 Jan97 Dec02 I911-MA0 I911.1-AR1 I911.1-MA0
## -0.3825 -0.6499 0.0989 -0.0690 0.0810 -0.0949 0.8139 -0.2715
## s.e. 0.0926 0.1189 0.0228 0.0218 0.0202 0.0462 0.0978 0.0439
##
## sigma^2 estimated as 0.0006721: log likelihood = 219.99, aic = -423.98
##
##  Ljung-Box test
##
## data:  Residuals from ARIMA(0,1,1)(0,1,1)[12]
## Q* = 22.889, df = 21, p-value = 0.3499
##
## Model df: 2. Total lags used: 2311.9.5 SARIMAX
The SARIMAX model simply adds a linear combination of exogenous variables to the SARIMA model. (Peixeiro 2022, 182)
Conforme (Peixeiro 2022, 182), o modelo SARIMAX pode ser definido ‘vagamente’ (loosely) por
\[\begin{equation} y_t = \text{SARIMA}(p,d,q)(P,D,Q)_m + \sum_{i=1}^{n} \beta_i X_{t}^i \tag{11.33} \end{equation}\]
11.9.6 ARFIMA
The family of autoregressive integrated moving-average processes, widely used in time series analysis, is generalized by permitting the degree of differencing to take fractional values. (Hosking 1981, 165)
The idea of fractional differencing is introduced in terms of the infinite filter that corresponds to the expansion of \((1-B)^d\). When the filter is applied to white noise, a class of time series is generated with distinctive properties, particularly in the very low frequencies and provides potentially useful long-memory forecasting properties. (Granger and Joyeux 1980, 15)
(McLeod and Hipel 1978) definem um processo estacionário de memória longa ou curta conforme suas correlações tendo soma infinita ou finita. O Teorema 1 apresentado por (Hosking 1981, 167–69) implica que para \(0 < d < 1/2\) o processo ARIMA\((0,d,0)\) é um processo estacionário de memória longa.
A função forecast::arfima() seleciona e estima um modelo ARFIMA\((p,d,q)\) automaticamente usando o algoritmo de (Rob J. Hyndman and Khandakar 2008) para selecionar \(p\) e \(q\), e o algoritmo de (Haslett and Raftery 1989) para estimar \(d\). Note que o argumento drange de valores admissíveis para \(d\) possui padrão c(0, 0.5), garantindo um modelo estacionário.
Exemplo 11.45 Baseado na documentação de forecast::arfima() estima-se o modelo \[(1-0.839096099B)(1-B)^{0.259293937}y_t = (1-0.403737461B-0.320792950B^2-0.008006003B^3)a_t\]\[a_t \sim N(0,1.005875)\]
library(forecast)
library(fracdiff)
set.seed(42)
x <- fracdiff::fracdiff.sim(10^4, ma=-.4, d=.3)$series
(fit <- forecast::arfima(x))
##
## Call:
## forecast::arfima(y = x)
##
## *** Warning during (fdcov) fit: unable to compute correlation matrix; maybe change 'h'
##
## Coefficients:
## d ar.ar1 ma.ma1 ma.ma2 ma.ma3
## 0.259293937 0.839096105 0.403737467 0.320792953 0.008006004
## sigma[eps] = 1.005875
## a list with components:
## [1] "log.likelihood" "n" "msg" "d" "ar"
## [6] "ma" "covariance.dpq" "fnormMin" "sigma" "stderror.dpq"
## [11] "correlation.dpq" "h" "d.tol" "M" "hessian.dpq"
## [16] "length.w" "residuals" "fitted" "call" "x"
## [21] "series"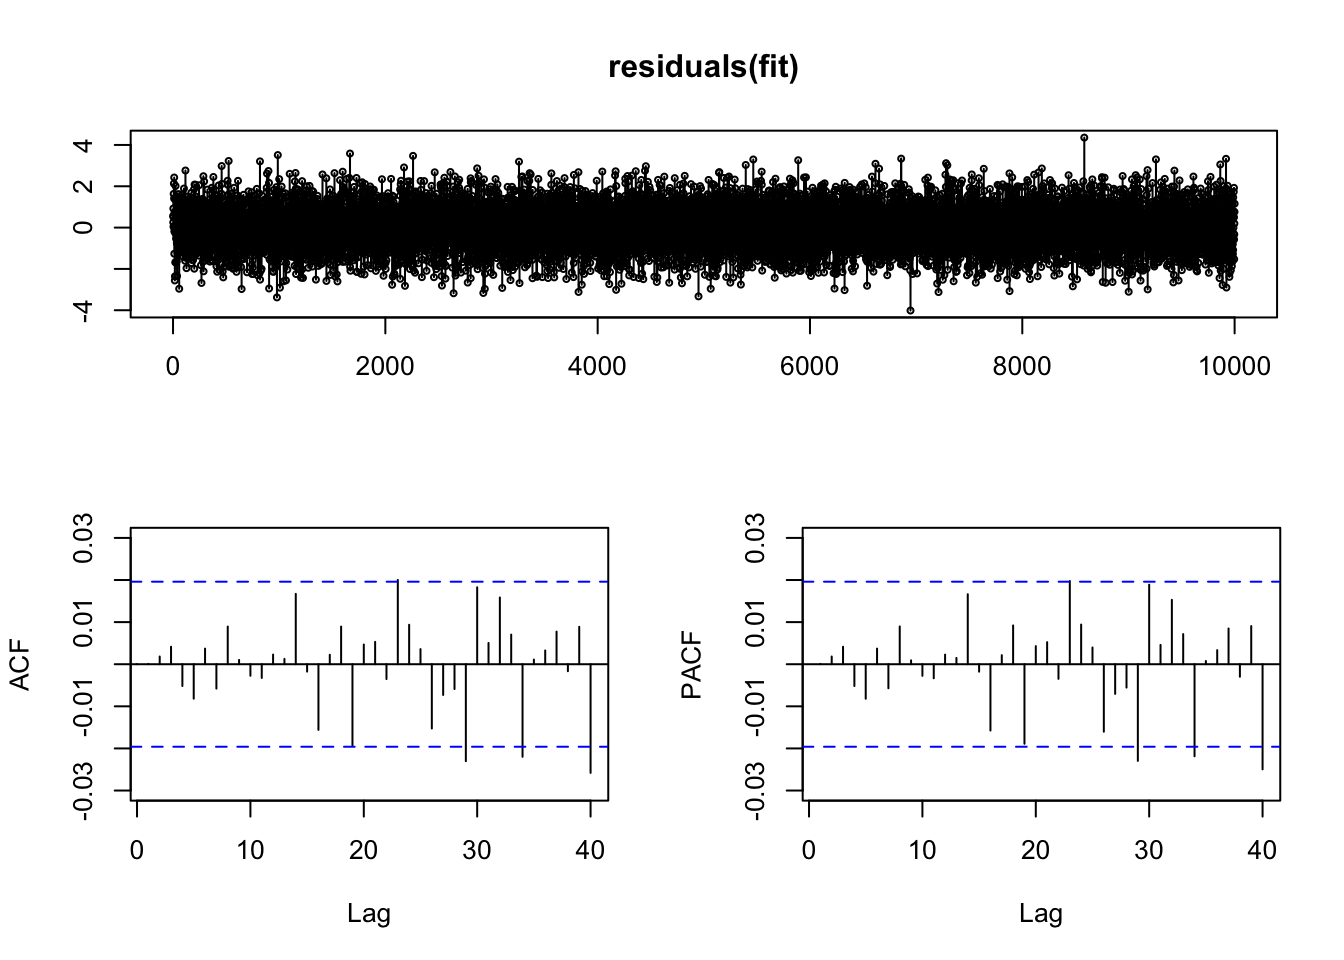
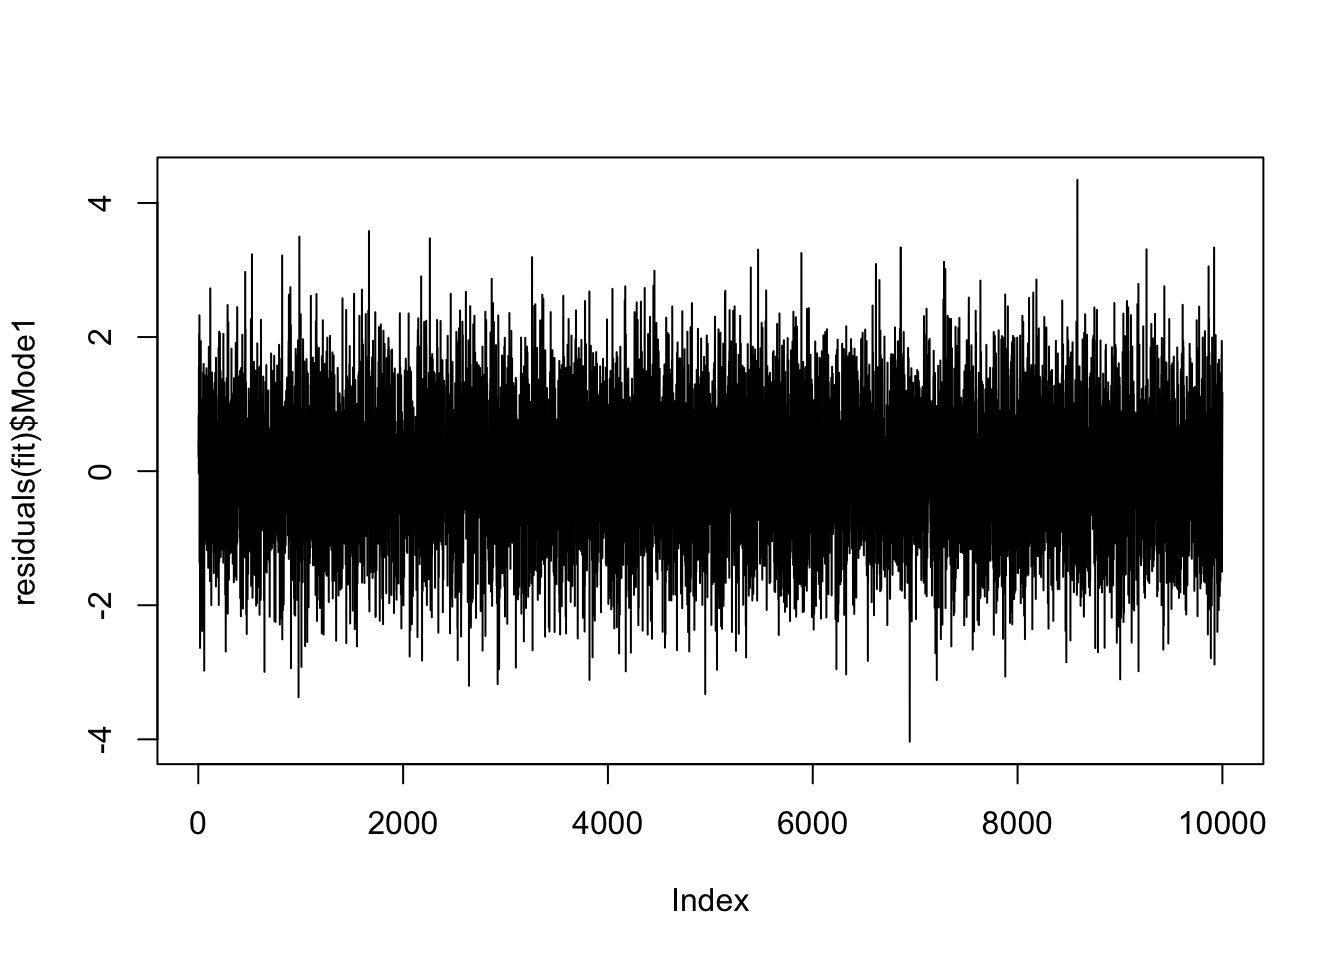
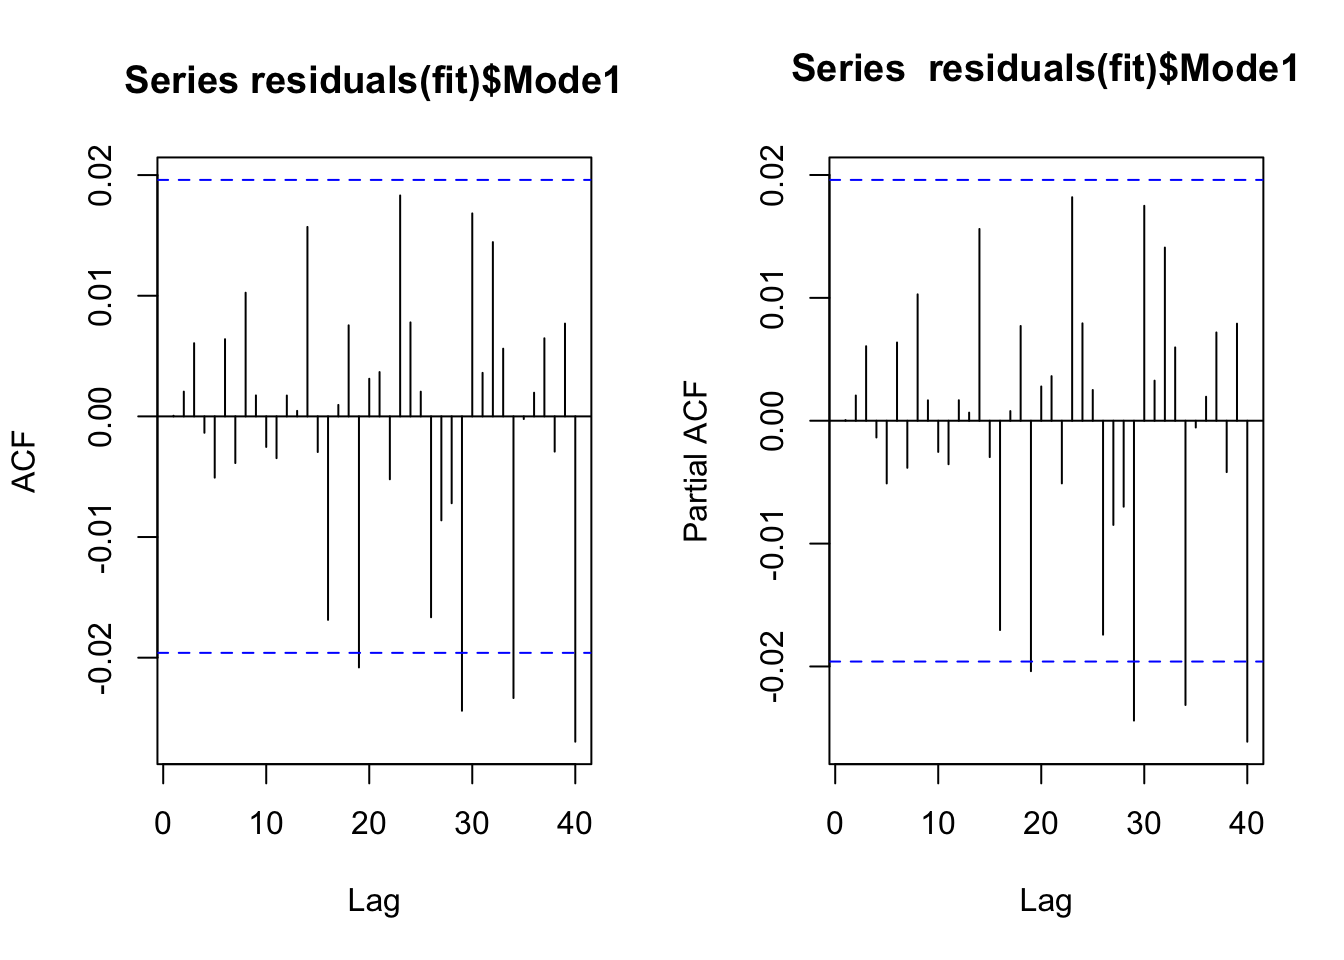
A função arfima::arfima() (Veenstra 2013) ajusta modelos ARFIMA, ARIMA-FGN e ARIMA-PLA por meio do argumento xreg, incluindo regressão dinâmica (funções de transferência).
Exemplo 11.46 Baseado nos resultados de forecast::arfima() e na documentação de arfima::arfima() estima-se o modelo \[(1+0.000745107B)(1-B)^{0.308484}y_t = -0.234623 + (1+0.387067B)a_t\]\[a_t \sim N(0,1.01243)\]
library(arfima)
library(fracdiff)
set.seed(42)
x <- fracdiff::fracdiff.sim(10^4, ma=-.4, d=.3)$series
(fit <- arfima::arfima(x, order = c(1,0,1)))
## Note: only one starting point. Only one mode can be found -- this is now the default behavior.
## Beginning the fits with 1 starting values.## Number of modes: 1
##
## Call:
## arfima::arfima(z = x, order = c(1, 0, 1))
##
## Coefficients for fits:
## Coef.1: SE.1:
## phi(1) -0.000745108 0.0379944
## theta(1) -0.387067 0.0273214
## d.f 0.308484 0.0146012
## Fitted mean -0.234623 0.26147
## logl -60.53
## sigma^2 1.01243
## Starred fits are close to invertibility/stationarity boundaries