11.6 Tratamento de séries temporais
11.6.1 Estatísticas móveis
Estatísticas móveis são úteis para suavizar curvas e auxiliar na modelagem de dados temporais.
- Médias móveis são calculadas pela função
ma()de forecast (Rob J. Hyndman and Khandakar 2008) erollmean()de zoo (Zeileis and Grothendieck 2005b) - zoo também fornece a função
rollapply(), além de outras funções específicas de estatísticas móveis. - slider (Vaughan 2023) fornece funções estáveis de janela móvel para qualquer tipo de dados R.
- tsibble (E. Wang, Cook, and Hyndman 2020b) fornece as funções
slide_tsibble()para estatísticas móveis etile_tsibble()para janelas móveis não sobrepostas. - tbrf (Time-Based Rolling Functions) (Schramm 2020) fornece funções de estatísticas móveis com base em janelas de data e hora, em vez de observações com \(n\) defasagens.
- roll (Foster 2020) fornece funções eficiente de estatísticas móveis e de expansão para dados de séries temporais.
- runner (Kałędkowski 2024) permite controlar o comprimento da janela, o atraso da janela e os índices de tempo, permitindo aplicar qualquer função R em janelas móveis em séries temporais com espaçamento igual e desigual.
- runstats (Karas and Urbanek 2019) fornece métodos computacionais rápidos para algumas estatísticas móveis.
- Para data.table (Barrett et al. 2024),
froll()pode ser usada para estatísticas móveis de alto desempenho.
Segundo a documentação, forecast::ma() implementa a equação
\[\begin{equation} \widehat{T}_t = \frac{1}{m} \sum_{j=-k}^{k} y_{t+j} \tag{11.1} \end{equation}\]
onde \(m\) é a ordem, \(k=\lceil \frac{m-1}{2} \rceil\) e \(t=1+k,\ldots,n-k\). O número de valores de \(\widehat{T}_t\) não NA é \(n-2k\) (por quê?). “[Q]uando uma ordem (\(m\)) par é especificada, a média das observações incluirá mais uma observação do futuro do que do passado (k é arredondado para cima). Se centre for TRUE, será calculada a média do valor de duas médias móveis (onde k é arredondado para cima e para baixo, respectivamente), centralizando a média móvel.”
Não há detalhes da implementação na documentação de zoo::rollmean().
Exemplo 11.27 Pode-se calcular a média móvel de variadas ordens da sequência 5 6 2 5 3 3 4 1 4 4.
x <- c(5,6,2,5,3,3,4,1,4,4)
for(m in 2:9){
  fc <- forecast::ma(x,m)
  print(paste0('m = ', m))
  print(round(zoo::coredata(fc),3))
}
## [1] "m = 2"
## [1] NA 4.75 3.75 3.75 3.50 3.25 3.00 2.50 3.25 NA
## [1] "m = 3"
## [1] NA 4.333 4.333 3.333 3.667 3.333 2.667 3.000 3.000 NA
## [1] "m = 4"
## [1] NA NA 4.250 3.625 3.500 3.250 2.875 3.125 NA NA
## [1] "m = 5"
## [1] NA NA 4.2 3.8 3.4 3.2 3.0 3.2 NA NA
## [1] "m = 6"
## [1] NA NA NA 3.917 3.417 3.167 3.250 NA NA NA
## [1] "m = 7"
## [1] NA NA NA 4.000 3.429 3.143 3.429 NA NA NA
## [1] "m = 8"
## [1] NA NA NA NA 3.562 3.375 NA NA NA NA
## [1] "m = 9"
## [1] NA NA NA NA 3.667 3.556 NA NA NA NAExemplo 11.28 Em Python.
import numpy as np
import pandas as pd

# Dados de entrada
x = np.array()

# Calculando a média móvel para diferentes valores de m
for m in range(2, 10):
    fc = pd.Series(x).rolling(window=m, center=True).mean()
    print(f'm = {m}')
    print(np.round(fc.values, 3))
Exemplo 11.29 Considere a série temporal fpp2::h02.
library(fpp2)
plot(h02)
sm1 <- forecast::ma(h02, order = 12)
sm2 <- zoo::rollmean(h02, k = 12)
lines(sm1, col = 'red2', lwd = 2)
lines(sm2, col = 'blue2', lwd = 2)
legend('topleft', legend = c('Original','forecast::ma','zoo::rollmean'),
       fill = c('black','red2','blue2'), cex = .8)
Pode-se implementar a média móvel a partir da Eq. (11.1).
# versão 1: ordem ímpar
mm <- function(x, m){
  n <- length(x)
  k <- ceiling((m-1)/2)
  Tt <- vector(length = n)
  for(i in (1+k):(n-k)){
    Tt[i] <- sum(x[(i-k):(i+k)])/m
  }
  return(Tt)
}
all.equal(mm(h02, 3), coredata(forecast::ma(h02, order = 3)))
## [1] "'is.NA' value mismatch: 2 in current 0 in target"Exemplo 11.30 Em Python.
import numpy as np
import pandas as pd
from statsmodels.datasets import co2

# Função mm() (mesma do exemplo anterior)
def mm(x, m):
    n = len(x)
    k = int(np.ceil((m - 1) / 2))
    Tt = np.zeros(n)
    for i in range(k, n - k):
        Tt[i] = np.mean(x[i - k: i + k + 1])
    return Tt

# Carregando o conjunto de dados co2 (equivalente a h02 em fpp2)
data = co2.load_pandas().data
h02 = data['co2'].values

# Comparando os resultados
result_mm = mm(h02, 3)
result_ma = pd.Series(h02).rolling(window=3, center=True).mean().values

# Verificando se os resultados são iguais
comparison = np.allclose(result_mm, result_ma, equal_nan=True)  # Usando np.allclose() para comparar arrays com NaN

print(f"Os resultados são iguais: {comparison}")
Exercício 11.10 Implemente uma função que calcule a média móvel para ordens pares e ímpares, conforme Eq (11.1).
11.6.2 Decomposição
A partir de “[u]ma pesquisa preliminar de gráficos de séries mensais fundamentais como compensações bancárias, produção de ferro, preços de commodities e novas licenças de construção”, (Persons 1919, 8) considera que cada série temporal “é um composto que consiste em quatro tipos de flutuações”:
- Uma tendência de longo prazo ou tendência secular;
- Um movimento cíclico ou em forma de onda sobreposto à tendência secular;
- Um movimento sazonal dentro do ano com uma forma característica para cada série;
- Variações residuais devido a desenvolvimentos que afetam séries individuais.
Diferença entre ciclo e sazonalidade
Segundo o artigo Cyclic and seasonal time series de Rob Hyndman, “sazonalidade é sempre de um período fixo e conhecido”, enquanto “um padrão cíclico existe quando os dados apresentam altas e baixas que não são de período fixo”. Ainda segundo Hyndman, “[e]m geral a duração média dos ciclos é maior que a duração de um padrão sazonal, e a magnitude dos ciclos tende a ser mais variável que a magnitude dos padrões sazonais”.
Diferença entre tendência estocástica e determinística
De acordo com a Seção 10.4 Stochastic and deterministic trends de (Rob J. Hyndman and Athanasopoulos 2021), “[h]á uma suposição implícita com tendências determinísticas de que a inclinação da tendência não vai mudar ao longo do tempo. Por outro lado, tendências estocásticas podem mudar, e o crescimento estimado é assumido apenas como o crescimento médio ao longo do período histórico, não necessariamente a taxa de crescimento que será observada no futuro. Consequentemente, é mais seguro prever com tendências estocásticas, especialmente para horizontes de previsão mais longos, pois os intervalos de previsão permitem maior incerteza no crescimento futuro”.
11.6.2.1 stats::decompose()
A função stats::decompose() por David Meyer está baseada em (Kendall and Stuart 1983). Decompõe uma série temporal em componentes de tendência, sazonais (aditivos ou multiplicativos) e residuais (irregulares) usando médias móveis. Os modelos aditivo e multiplicativo são respectivamente
\[\begin{equation} y_t = T_t + S_t + R_t \tag{11.2} \end{equation}\]
\[\begin{equation} y_t = T_t S_t R_t \tag{11.3} \end{equation}\]
A biblioteca statsmodel (Seabold and Perktold 2010) do Python fornece ferramentas para decompor uma série temporal via médias móveis.

Exemplo 11.31 Em Python.
import matplotlib.pyplot as plt
from statsmodels.tsa.seasonal import seasonal_decompose
from statsmodels.datasets import co2

# Carregando os dados CO2 (equivalente a h02 em fpp2)
data = co2.load_pandas().data
data.index = data.index.to_period('M')

# Decompondo a série temporal
decomposition = seasonal_decompose(data['co2'], model='additive')

# Plotando a decomposição
decomposition.plot()
plt.show()
A partir da Seção 3.4 Classical Decomposition de (Rob J. Hyndman and Athanasopoulos 2021) apresenta-se o algortimo de decomposição aditiva.
Decomposição aditiva
Passo 1
Calcule \(\widehat{T}_t\) conforme Eq. (11.1).
Passo 2
Calcule a série sem tendência: \(\widehat{SST}_t = y_t-\widehat{T}_t\).
Passo 3
Calcule a média dos valores sem tendência para cada ciclo. Ajuste para garantir soma zero. Replique os períodos para todos os anos, resultando em \(\widehat{S}_t\).
Passo 4
O componente restante é calculado subtraindo os componentes sazonais e de ciclo de tendência estimados: \(\widehat{R}_t= y_t - \widehat{T}_t - \widehat{S}_t\).
Exemplo 11.32 Reproduzindo os passos da decomposição aditiva.
# Passo 0 - série original
yt <- fpp2::h02
f <- frequency(yt) # ciclo
s <- start(yt)     # início
e <- end(yt)       # fim
# Passo 1 - média móvel
Tt <- forecast::ma(yt, order = f)
# Passo 2 - série sem tendência
SSTt <- yt-Tt
# Passo 3 - média padronizada por ciclo
mc <- vector(length = f) # média por ciclo
for(i in 1:f){
  fltr <- seq(from = i, by = f, length.out = ceiling(length(yt)/f))
  ifelse((s[2]+i-1) > f, indx <- (s[2]+i-1) %% f, indx <- (s[2]+i-1))
  mc[indx] <- mean(SSTt[fltr], na.rm = TRUE)
}
if(s[2] == 1){
 indx <- 1:f
} else{
  indx <- c((s[2]:f),1:(s[2]-1))
}
mc0 <- mc-mean(mc) # média padronizada por ciclo
St <- rep(mc0[indx], ceiling(length(yt)/f)) # replicando para todos os anos
St <- ts(St, start = s, end = e, frequency = f)
# Passo 4
Rt <- yt-Tt-St
# Gráficos
par(mfrow=c(2,2))
plot(yt, type = 'l', main = 'Série original')
plot(Tt, type = 'l', main = 'Tendência')
plot(St, type = 'l', main = 'Sazonalidade')
plot(Rt, type = 'l', main = 'Resíduo')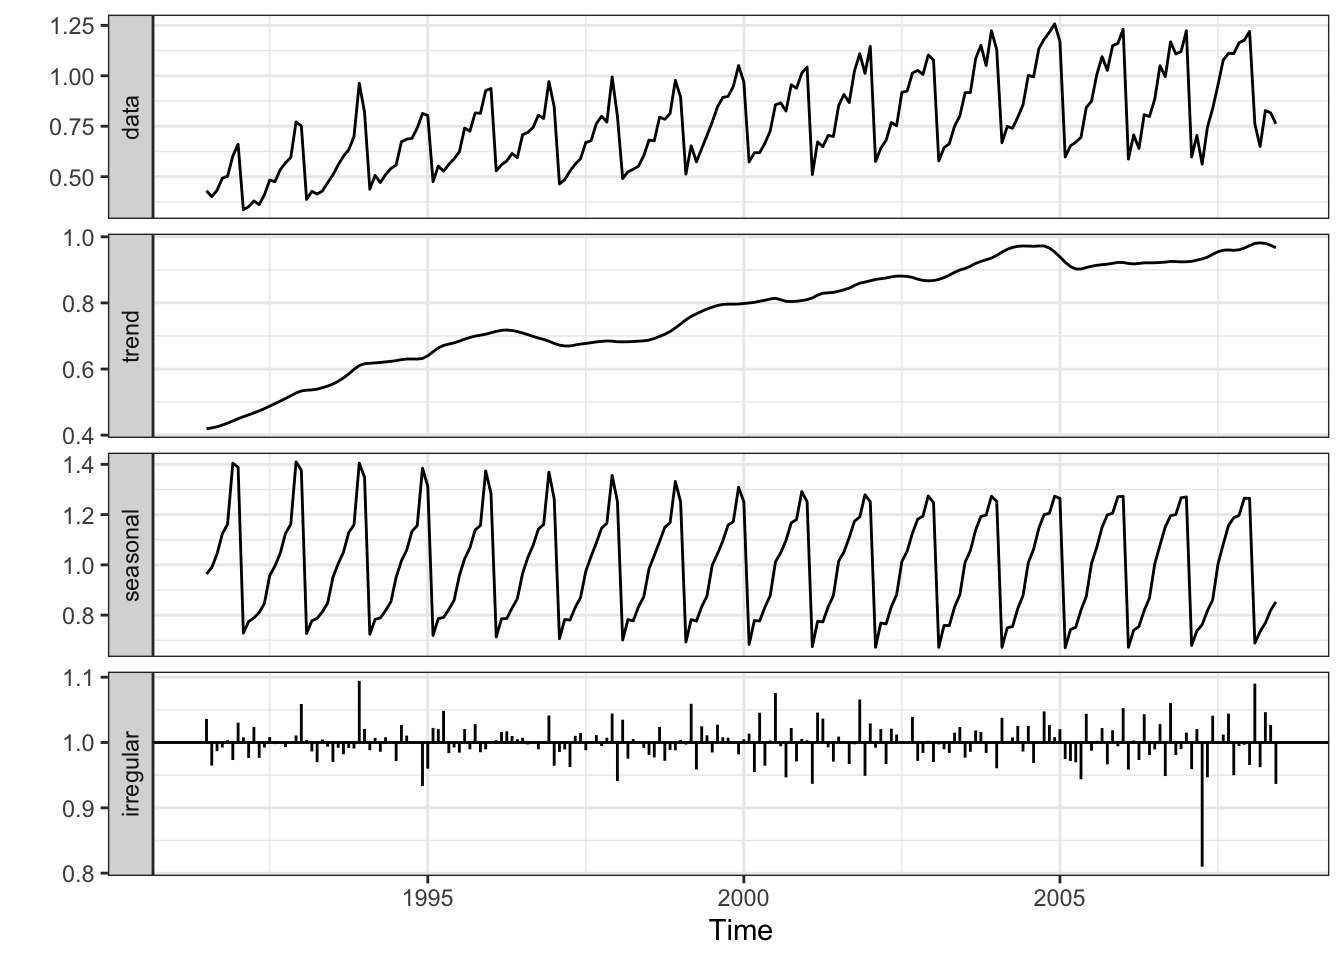
## [1] TRUE## [1] TRUE## [1] TRUE## [1] TRUEExemplo 11.33 Em Python.
import numpy as np
import pandas as pd
import matplotlib.pyplot as plt
from statsmodels.datasets import co2

# Carregando o conjunto de dados co2 (equivalente a h02 em fpp2)
data = co2.load_pandas().data
data.index = data.index.to_period('M')  # Convertendo o índice para períodos mensais
yt = data['co2']

# Passo 0 - série original
f = 12  # ciclo (frequência anual)
s = data.index  # início
e = data.index[-1]  # fim

# Passo 1 - média móvel
Tt = yt.rolling(window=f, center=True).mean()

# Passo 2 - série sem tendência
SSTt = yt - Tt

# Passo 3 - média padronizada por ciclo
mc = np.zeros(f)
for i in range(1, f + 1):
    fltr = SSTt.iloc[i-1::f]
    indx = (s.month + i - 2) % f  # Ajuste para índice em Python (começa em 0)
    mc[indx] = np.nanmean(fltr)  # Usando nanmean para ignorar NaNs

# Ajustando o índice para começar no mês correto
if s.month == 1:
    indx = np.arange(f)
else:
    indx = np.concatenate([np.arange(s.month - 1, f), np.arange(s.month - 1)])

mc0 = mc - np.mean(mc)
St = np.tile(mc0[indx], int(np.ceil(len(yt) / f)))
St = St[:len(yt)]  # Ajustando o tamanho da série
St = pd.Series(St, index=data.index)

# Passo 4
Rt = yt - Tt - St

# Gráficos
fig, axes = plt.subplots(2, 2, figsize=(12, 8))
axes.plot(yt)
axes.set_title('Série original')
axes.plot(Tt)
axes.set_title('Tendência')
axes.plot(St)
axes.set_title('Sazonalidade')
axes.plot(Rt)
axes.set_title('Resíduo')
plt.tight_layout()
plt.show()

# Comparando com seasonal_decompose()
from statsmodels.tsa.seasonal import seasonal_decompose

d = seasonal_decompose(yt, model='additive')

# Imprimindo as comparações
print(f"Série original igual: {np.allclose(d.observed, yt, equal_nan=True)}")
print(f"Tendência igual: {np.allclose(d.trend, Tt, equal_nan=True)}")
print(f"Sazonalidade igual: {np.allclose(d.seasonal, St, equal_nan=True)}")
print(f"Resíduo igual: {np.allclose(d.resid, Rt, equal_nan=True)}")
11.6.2.2 stats::stl()
A função stats::stl() (Seasonal Trend Loess) é baseada em (Cleveland et al. 1990), e também decompõe uma série temporal em componentes de tendência, sazonais e irregulares, porém utilizando stats::loess() (LOcally Estimated Scatterplot Smoothing).
A biblioteca statsmodel (Seabold and Perktold 2010) do Python fornece ferramentas para decompor uma série temporal via LOESS.

11.6.2.3 X-13ARIMA-SEATS
(Sax and Eddelbuettel 2018) apresentam a biblioteca seasonal, cuja função principal seas() aplica os procedimentos automáticos X-13ARIMA-SEATS para realizar um ajuste sazonal bastante geral. De acordo com (U.S. Census Bureau 2023), o programa de ajuste sazonal X-13ARIMA-SEATS é uma versão aprimorada da Variante X-11 do Programa de Ajustamento Sazonal do Método II do Censo17 (Shiskin, Young, and Musgrave 1967). Para uma abordagem mais didática recomenda-se (Dagum and Bianconcini 2016).
A biblioteca statsmodel (Seabold and Perktold 2010) do Python fornece ferramentas para identificação automática da ordem do ARIMA sazonais usando ARIMA x12/x13, bem como para a execução da análise X13-ARIMA para dados mensais ou trimestrais.


Exemplo 11.34 Em Python.
import matplotlib.pyplot as plt
from statsmodels.tsa.seasonal import STL
from statsmodels.datasets import co2

# Carregando o conjunto de dados co2 (equivalente a h02 em fpp2)
data = co2.load_pandas().data
data.index = data.index.to_period('M')

# Decompondo a série temporal com STL
stl = STL(data['co2'], period=12)
result = stl.fit()

# Plotando a decomposição com STL
result.plot()
plt.show()

# X-13ARIMA-SEATS e X-11 não têm equivalentes diretos em Python
# Para usar X-13ARIMA-SEATS, você pode tentar a biblioteca 'seasonal' (requer instalação separada e configuração do caminho para o executável X-13ARIMA-SEATS)
try:
    from seasonal import seas

    # Decompondo com X-13ARIMA-SEATS
    result_x13 = seas(data['co2'])
    result_x13.plot()
    plt.show()

    # Decompondo com X-11
    result_x11 = seas(data['co2'], x11='')
    result_x11.plot()
    plt.show()

except ImportError:
    print("A biblioteca 'seasonal' não está instalada ou o executável X-13ARIMA-SEATS não está configurado corretamente.")
11.6.2.4 Sazonalidade complexa
Características
- Múltiplos períodos sazonais, não necessariamente aninhados
- Sazonalidade que depende de covariáveis
- Sazonalidade não inteira
- Topografia sazonal irregular
- Topologia sazonal complexa
Soluções
- MSTL
- (Bandara, Hyndman, and Bergmeir 2021)
- Para múltiplos períodos sazonais inteiros
- Implementado nos pacotes R
forecastefable
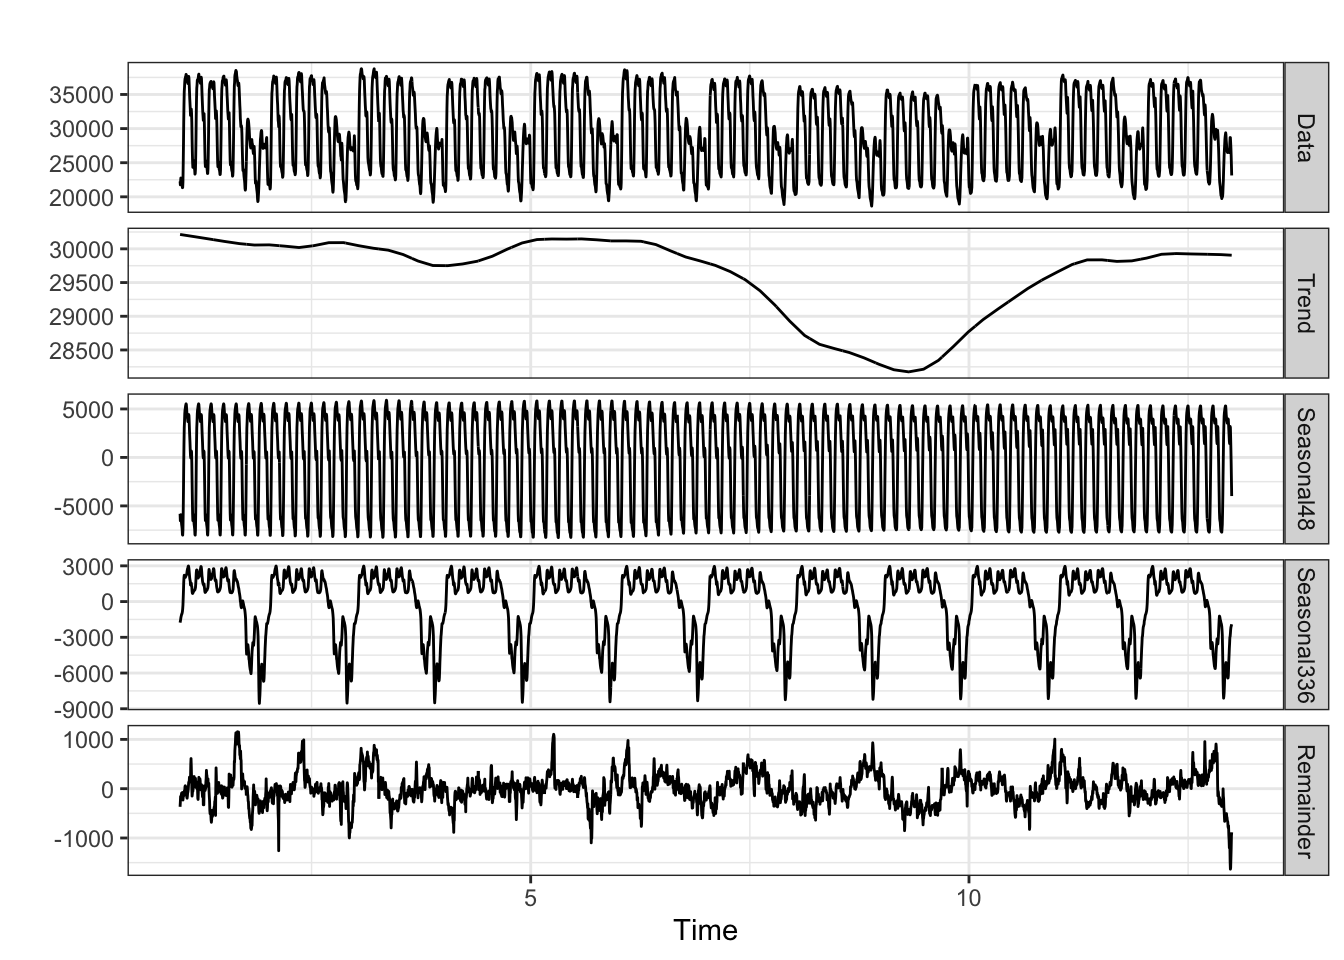
Exemplo 11.35 Exemplo adaptado na documentação de forecast::mstl().
library(ggplot2)
library(forecast)

# Decomposição de uma série temporal mensal
mstl(USAccDeaths) %>%
  autoplot()
- STR
- (Dokumentov and Hyndman 2022)
- Para todos os tipos de sazonalidade complexa
- Implementado no pacote R
stR
Exemplo 11.36 Exemplo adaptado na documentação de stR::AutoSTR().
library(stR)
# Decomposição de uma série temporal mensal
decomp <- AutoSTR(USAccDeaths)
plot(decomp)
# Decomposição de uma série temporal sazonal múltipla
decomp <- AutoSTR(taylor) # pode demorar um pouco
plot(decomp)
Exercício 11.11 Veja as seguintes documentações.
11.6.3 Diferenças
Differencing provides a simple aproach to removing, rather than highlighting, trends in time-series data. (Diggle 1990, 31)
O número de diferenças necessárias para eliminar a tendência indica a ordem \(d\) do \(ARIMA(p,d,q)\).
A primeira diferença de uma série temporal \(y_{t}\) (backward difference operator) é definida por \[\begin{equation} \nabla y_{t} = y_{t} - y_{t-1} \tag{11.4} \end{equation}\]
A segunda diferença de uma série temporal \(y_{t}\) é definida por \[\begin{equation} \nabla^{2}y_{t} = \nabla(\nabla y_{t}) = \nabla y_{t} - \nabla y_{t-1} = y_{t} - 2y_{t-1} + y_{t-2} \tag{11.5} \end{equation}\]
A função base::diff() retorna diferenças adequadamente defasadas e iteradas.


A função base::diffinv() retorna o inverso de base::diff(). Note que o argumento xi indica o(s) valor(es) inicial(is) da série temporal.
## [1] TRUE## [1] TRUEExemplo 11.37 Em Python.
import matplotlib.pyplot as plt
import pandas as pd
from statsmodels.datasets import co2
from pmdarima.utils import diff_inv

# Carregando o conjunto de dados co2 (equivalente a h02 em fpp2)
data = co2.load_pandas().data
data.index = data.index.to_period('M')
h02 = data['co2']

# Calculando as diferenças
d = h02.diff(1).dropna()  # Uma diferença
d2 = h02.diff(2).dropna()  # Duas diferenças

# Plotando os gráficos
plt.figure(figsize=(12, 8))

plt.subplot(3, 1, 1)
plt.plot(h02)
plt.title('Original')

plt.subplot(3, 1, 2)
plt.plot(d)
plt.title('Uma diferença')

plt.subplot(3, 1, 3)
plt.plot(d2)
plt.title('Duas diferenças')

plt.tight_layout()
plt.show()

# Invertendo as diferenças
h02_inv_d = diff_inv(d.values, 1, xi=h02)
h02_inv_d2 = diff_inv(d2.values, 2, xi=[h02, h02])

# Comparando os resultados
print(f"h02 == diffinv(d): {np.allclose(h02.values, h02_inv_d, equal_nan=True)}")
print(f"h02 == diffinv(d2): {np.allclose(h02.values, h02_inv_d2, equal_nan=True)}")
11.6.3.1 Operador Backshift
The backward shift operator: a convenient notational shorthand. (Diggle 1990, 72)
\[\begin{equation} B^m y_{t} = y_{t-m} \tag{11.6} \end{equation}\]
Note que \(\nabla y_t = (1-B)y_{t}\) e \(\nabla^2 y_t = (1-2B+B^2)y_{t}\).
Exercício 11.12 Veja a Seção Backshift notation de (Rob J. Hyndman and Athanasopoulos 2021).
Exercício 11.13 Expanda as seguintes expressões ou modelos.
- \(B^{3}y_t\)
- \((1-B^{2})y_t\)
- \((1-B)^{2}y_t\)
Exercício 11.14 Escreva em notação backshift.
- \(y_t + y_{t-1} + y_{t-2}\)
- \(y_t - 2y_{t-3} + y_{t-12}\)
- \(y_{t-3} + 2y_{t-6} + y_{t-12}\)
11.6.4 Suavizadores de Tukey
As a fitting process, it leads to the general relation
data = fit PLUS residualswhich here can be writtengiven data = smooth PLUS rough. (Tukey 1977, 208)
A função stats::smooth() aplica os suavizadores (de mediana) de Tukey 3, 3R, S, 3RSS e 3RS3R conforme (Tukey 1977, 205–36).
- 3 é a notação curta de Tukey para medianas móveis de comprimento 3
- 3R 3 Repetido até convergência (3-ing it to the death) (Tukey 1977, 230)
- S divisão de trechos horizontais de comprimento 2 ou 3
- SR divisão até convergência (split it to the death)
Exemplo 11.38 Será considerado o conjunto de 13 observações discutido na Seção 7.A Medians of 3 de (Tukey 1977, 210).
| Dado | 3 | Resto 3 | 3R | Resto 3R |
|---|---|---|---|---|
| 4 | NA |
NA |
NA |
NA |
| 7 | 7 | 0 | NA |
NA |
| 9 | 7 | 2 | 7 | 2 |
| 3 | 4 | -1 | 4 | -1 |
| 4 | 4 | 1 | 4 | 0 |
| 11 | 11 | 0 | 11 | 0 |
| 12 | 12 | 0 | 12 | 0 |
| 1304 | 12 | 1292 | 12 | 1292 |
| 10 | 15 | -5 | 12 | -2 |
| 15 | 12 | 3 | 13 | 3 |
| 12 | 13 | -1 | 13 | -1 |
| 13 | 13 | 0 | NA |
NA |
| 17 | NA |
NA |
NA |
NA |
tk210 <- c(4,7,9,3,4,11,12,1304,10,15,12,13,17)
(s3 <- stats::smooth(tk210, '3')) # suavizado por mediana de 3
## 3 Tukey smoother resulting from stats::smooth(x = tk210, kind = "3")
## used 1 iterations
## [1] 7 7 7 4 4 11 12 12 15 12 13 13 13## 3 Tukey smoother resulting from stats::smooth(x = s3, kind = "3")
## used 1 iterations
## [1] 7 7 7 4 4 11 12 12 12 13 13 13 13## 3R Tukey smoother resulting from stats::smooth(x = tk210, kind = "3R")
## used 2 iterations
## [1] 7 7 7 4 4 11 12 12 12 13 13 13 13Exercício 11.15 Considere os conjuntos de dados de produção de carvão e depósitos suspensos descritos por (Tukey 1977, 212).
- Obtenha a suavização por mediana de 3.
- Obtenha 3R.
- Faça o gráfico dos pontos originais e suavizados.
- Verifique quantas suavizações são necessárias para a convergência.
11.6.5 Filtro de Kalman
An important class of theoretical and practical problems in communication and control is of a statistical nature. Such problems are: (i) Prediction of random signals; (ii) separation of random signals from random noise; (iii) detection of signals of known form (pulses, sinusoids) in the presence of random noise. (R. Kálmán 1960, 35)
O filtro de Kalman “é um procedimento recursivo para calcular o estimador ótimo do vetor de estado no tempo \(t\), com base nas informações disponíveis no tempo \(t\)”18 (Harvey 1989, 104).
Conforme asserta a Lei da Eponímia de Stigler (S. M. Stigler 1980), o método foi desenvolvido e redescoberto em diferentes momentos da história, desde os achados de Thorvald N. Thiele (Thiele 1880) – que de acordo com (Lauritzen 1981) formulou e analisou o procedimento atualmente conhecido como filtro de Kalman – passando por Ruslan L. Stratonovich (Stratonovich 1957), Peter Swerling (Swerling 1958), dentre outros, até chegar aos populares trabalhos de Rudolf E. Kálmán (R. Kálmán 1960) e Richard S. Bucy (R. E. Kálmán and Bucy 1961). Para uma perspectiva bayesiana, veja (West and Harrison 2006) e (Gurajala et al. 2021).
Serão adotadas a estrutura e notação de (Harvey 1989), que admite que para certos enfoques “é necessário apenas entender o que o filtro faz, e não como ele faz”19, e reforça que “aqueles interessados principalmente nos aspectos práticos da modelagem de séries temporais estruturais (…) não precisam dominar todos os detalhes técnicos do filtro de Kalman aqui apresentados”20.
11.6.5.1 Suavizador de Kalman
The aim of filtering is to find the expected value of the state vector, \(\boldsymbol{\alpha}_t\), conditional on the information available at time \(t\), that is \(E(\boldsymbol{\alpha}_t | \boldsymbol{Y}_t)\). The aim of smoothing is to take account of the information made available after time \(t\). The mean of the distribution of \(\boldsymbol{\alpha}_t\), conditional on all the sample, may be written as \(E(\boldsymbol{\alpha}_t | \boldsymbol{Y}_T)\) and is known as a smoothed estimate. The corresponding estimator is called a smoother. Since the smoother is based on more information than the filtered estimator, it will have a MSE which, in general, is smaller than that of the filtered estimator; it cannot be greater. (Harvey 1989, 149–50)
11.6.5.2 Pacote dlm
Hence modelling may be phrased in terms of Dynamic Models defined generally as “sequences of sets of models”. (West and Harrison 1989, 6)
O pacote dlm (Petris 2009, 2010) fornece rotinas para máxima verossimilhança, filtragem e suavização de Kalman e análise bayesiana de modelos de espaço de estados lineares normais, também conhecidos como Modelos Lineares Dinâmicos (Petris, Petrone, and Campagnoli 2009). As funções dlm::dlmFilter() e dlm::dlmSmooth() aplicam respectivamente o filtro e o suavizador de Kalman para calcular valores filtrados/suavizados dos vetores de estado, juntamente com suas matrizes de covariância.
Exemplo 11.39 Considere a série do fluxo anual do rio Nilo medida em \(10^8 m^3\) entre 1871 e 1970, apresentada por (Cobb 1978, 249) e disponível em datasets::Nile.
library(dlm)
y <- datasets::Nile
# função que pega um vetor de mesmo comprimento de par e retorna um objeto da classe dlm (build)
dlm_Build <- function(par) {
  dlm::dlmModPoly(1, dV = exp(par[1]), dW = exp(par[2]))
}
dlm_MLE <- dlm::dlmMLE(y, rep(0,2), dlm_Build) # estimativa de máxima verossimilhança do DLM
dlm_Mod <- dlm_Build(dlm_MLE$par) # cria o filtro de Kalman (polinônio DLM de n-ésima ordem)
dlm_Filter <- dlm::dlmFilter(y, dlm_Mod) # aplica o filtro de Kalman nos dados
dlm_Smooth <- dlm::dlmSmooth(dlm_Filter) # aplica o suavizador de Kalman nos dados filtrados
plot(cbind(y, dlm_Filter$m[-1], dlm_Smooth$s[-1]),
     plot.type = 's', col=c('black','red2','blue2'),
     ylab='Nível', xlab ='Tempo', main='Rio Nilo', lwd=c(1,1.5,1.5))
legend('bottomright', legend = c('Original','Fitrada','Suavizada'),
       fill = c('black','red2','blue2'), cex = .8)
Exercício 11.16 Considere o Exemplo 11.39.
- Compare com o suavizador de Tukey de sua preferência.
- Calcule o MSE das séries filtrada e suavizada e relação à série original, bem como do suavizador do item a.
- Veja esta discussão sobre a diferença entre filtro e suavizador de Kalman. Avalie os tópicos discutidos, pontuando positivamente os que se destacam.
11.6.5.3 Pacote KFAS
(Helske 2017) apresenta a biblioteca KFAS (Kalman Filtering And Smoothing), que fornece um filtro de Kalman multivariado rápido, com simulação, suavizadores e previsão. Os algoritmos por de KFAS são baseados principalmente em (Durbin and Koopman 2012).
Exercício 11.17 Veja
11.6.6 Outros filtros
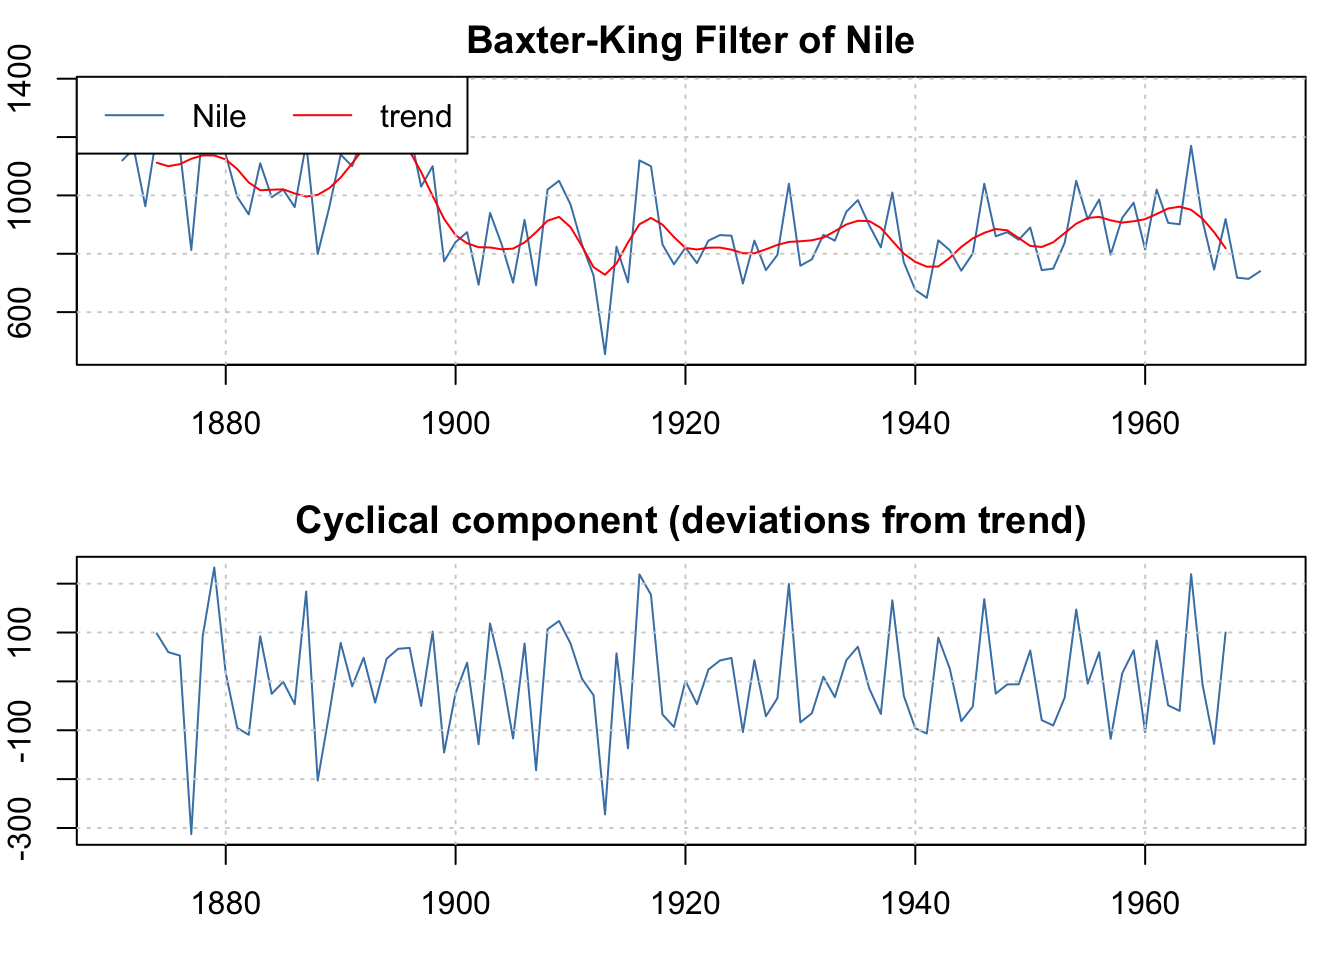
O pacote mFilter (Balcilar 2019) fornece filtros para séries temporais, tais como
- Butterworth (Butterworth et al. 1930)
- Hodrick-Prescott (Hodrick and Prescott 1997)
- Baxter-King (Baxter and King 1999)
- Christiano-Fitzgerald (Christiano and Fitzgerald 2003)

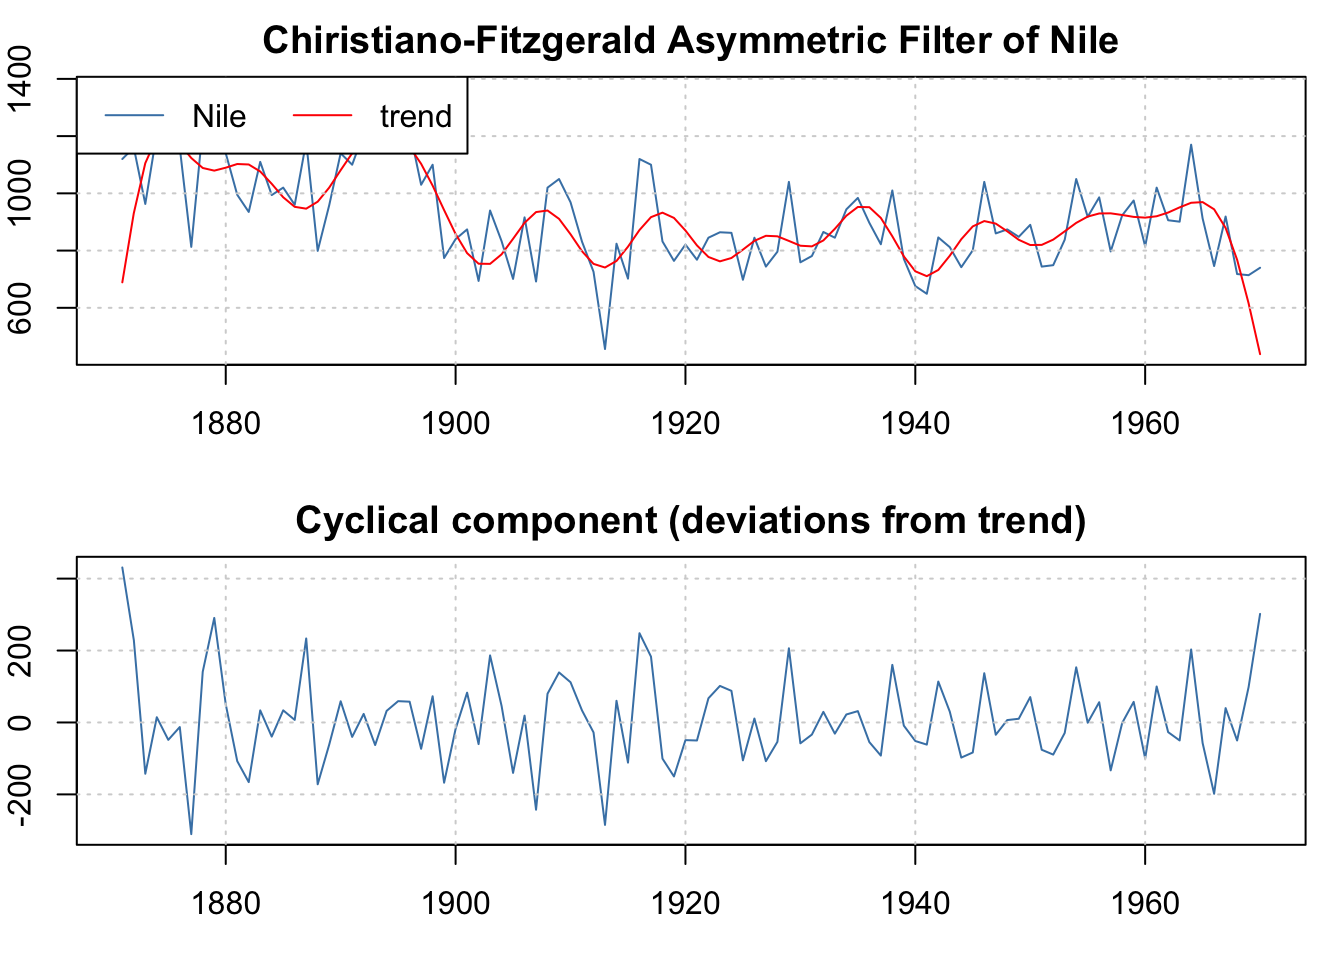
Exercício 11.18 Considere os filtros discutidos.
- Investigue os demais métodos do pacote
mFilter, rodando os exemplos. - Encontre implementações em Python e compare as referências e resultados.
11.6.7 Valores faltantes e imputação
A função forecast::na.interp() usa, por padrão, interpolação linear para séries não sazonais. Para séries sazonais, uma decomposição STL robusta é primeiro computada. Então, uma interpolação linear é aplicada aos dados ajustados sazonalmente, e o componente sazonal é adicionado novamente.
fc <- forecast::na.interp(gold)
plot(fc, main = 'Série gold com valores imputados em vermelho')
na <- which(is.na(forecast::gold))
points(na, fc[na], col = 'red')
O pacote imputeTS (Moritz and Bartz-Beielstein 2017) apresenta funções para imputação (substituição) de valores ausentes em séries temporais univariadas. Oferece várias funções de imputação e gráficos de dados ausentes. Os algoritmos de imputação disponíveis incluem: ‘Média’, ‘LOCF’, ‘Interpolação’, ‘Média Móvel’, ‘Decomposição Sazonal’, ‘Suavização de Kalman em modelos de Séries Temporais Estruturais’ e ‘Suavização de Kalman em modelos ARIMA’.
library(imputeTS)
imp <- imputeTS::na_kalman(tsAirgap)
ggplot_na_imputations(tsAirgap, imp, tsAirgapComplete)
11.6.8 Detecção de outliers
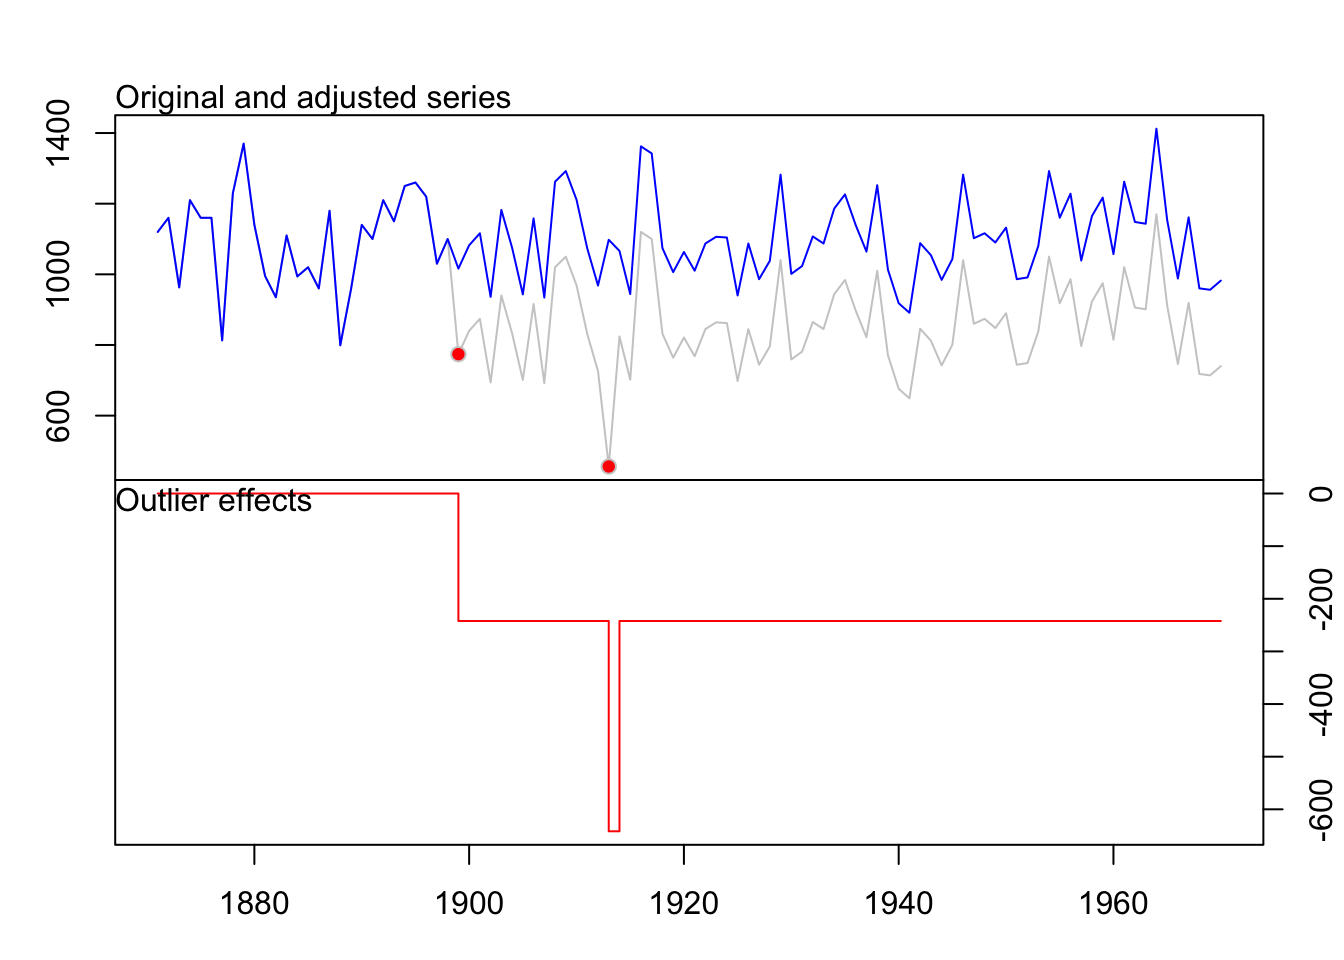
O pacote tsoutliers (López-de-Lacalle 2024) traz funções para detecção de outliers em séries temporais seguindo o procedimento de (Chen and Liu 1993). Outliers inovadores, outliers aditivos, mudanças de nível, mudanças temporárias e mudanças de nível sazonais são considerados.
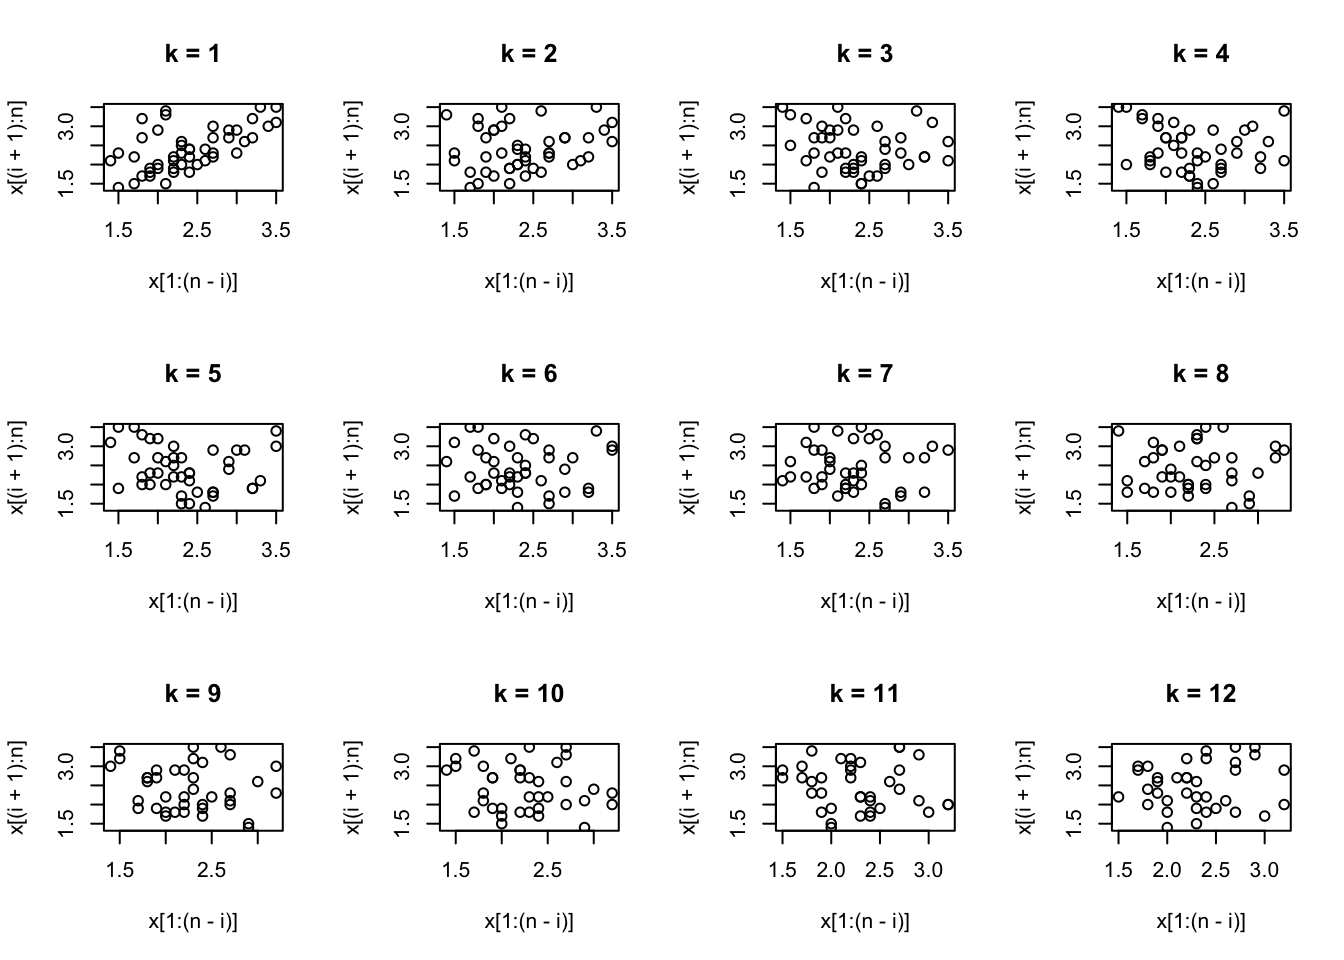
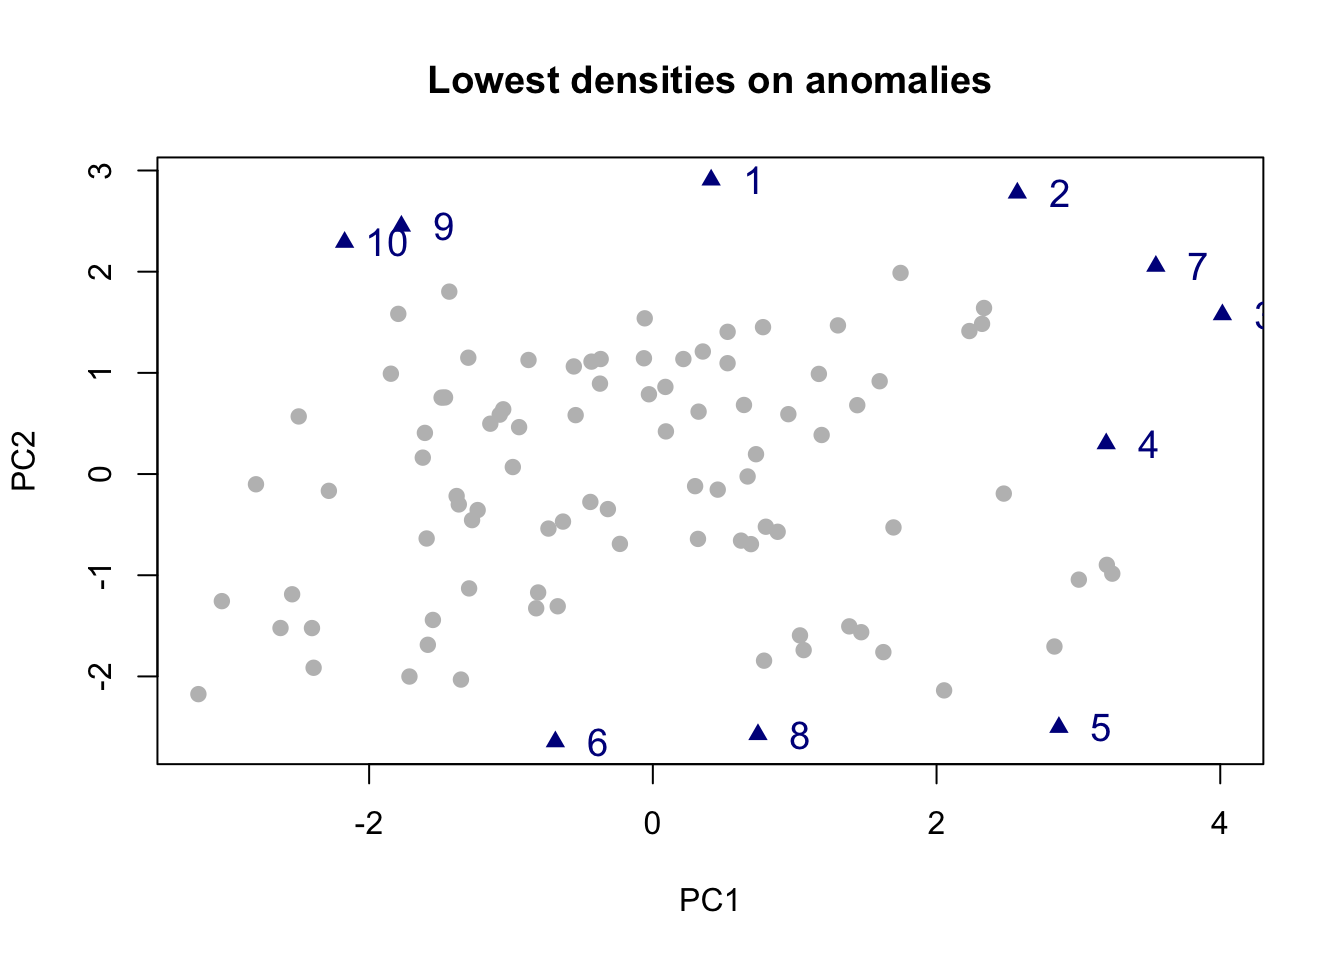
O pacote anomalous (Rob J. Hyndman, Wang, and Laptev 2024) possui métodos que calculam características em diversas séries temporais, podendo incluir correlação de defasagem, força da sazonalidade, entropia espectral, etc. Então, uma decomposição de componentes principais é usada nas características, e vários métodos de detecção de outliers bivariados são aplicados aos dois primeiros componentes principais. Isso permite que as séries mais incomuns, com base em seus vetores de características, sejam identificadas.
library(anomalous)
z <- ts(matrix(rnorm(3000), ncol=100), freq=4)
y <- tsmeasures(z)
biplot.features(y)

References
The X-11 Variant of The Census Method II Seasonal Adjustment Program.↩︎
The Kalman filter is a recursive procedure for computing the optimal estimator of the state vector at time \(t\), based on the information available at time \(t\). (Harvey 1989, 104)↩︎
For those who are primarily interested in carrying out applied work with structural time series models, ti should perhaps be stressed that the Kalman filter is simply a statistical algorithm, and it is only necessary to understand what the filter does, rather than how it does it. The same is true of the frequency-domain methods which can be used to construct the likelihood function. (Harvey 1989,xi)↩︎
[T]hose interested primarily in the practical aspects of structural time series modelling will be reassured to know that they do not have to master all the technical details of the Kalman filter set out here. (Harvey 1989, 100)↩︎