11.8 Testes
11.8.1 Testes de independência
The aim of time-series modeling may be thought of as, given an observed series, finding a transformation which when applied to the series yields a residual series whose members are independent and identically distributed. (Kotz et al. 2005, 6297)
Os testes a seguir são chamados de portmanteau.
11.8.1.1 Teste de Box-Pierce
[I]f the fitted model is appropriate and the parameters \(\phi\) are exactly known, then the calculated \(a_t\)’s would be uncorrelated normal deviates, their serial correlations \(r\) would be approximately \(N(0,(1/n)I)\), and thus \(n \sum_{1}^{m} r_{k}^2\) would possess a \(\chi^2\) distribution with \(m\) degrees of freedom. (G. E. P. Box and Pierce 1970, 1517)
\[\left\{ \begin{array}{l} H_0: \text{A série temporal é distribuída de forma independente.}\\ H_1: \text{A série temporal não é distribuída de forma independente, possuindo correlação serial.} \\ \end{array} \right. \]
Considerando \(Q \equiv Q(\hat{r})\), as estimativas \(\hat{\rho}(k)\) e \(n\) suficientemente grande, \[\begin{equation} Q = n \sum_{k=1}^{m} \hat{\rho}(k)^2 \sim \chi_{m-p-q}^2 \tag{11.13} \end{equation}\] onde \(n\) é o número de observações, \(\hat{\rho}(k)\) é a estimativa da autocorrelação de ordem \(k\) conforme Eq. (11.8), \(m\) é o número de lags considerados, \(p\) é a ordem autorregressiva e \(q\) a ordem das médias móveis no modelo ARMA.
11.8.1.2 Teste de Ljung-Box
The observed discrepancies [of “suspiciously low values of \(Q(\hat{r})\)”] could be accounted for by several factors, for instance departures from normality of the autocorrelations. (Ljung and Box 1978, 298)
Considerando as discrepâncias observadas, (Ljung and Box 1978, 298) sugerem uma estatística de teste modificada \[\begin{equation} \tilde{Q} = n(n+2) \sum_{k=1}^{m} \frac{\hat{\rho}(k)^2}{n-k} \sim \chi_{m-p-q}^2 \tag{11.14} \end{equation}\] com os mesmos argumentos de \(Q\).
A função stats::Box.test() calcula a estatística de teste Box–Pierce ou Ljung–Box para examinar a hipótese nula de independência em uma série temporal, baseada em (G. E. P. Box and Pierce 1970), (Ljung and Box 1978) e (Harvey 1993). Note que \(m=\)lag, a função não opera com NA, e traz em sua documentação o detalhe a seguir.
These tests are sometimes applied to the residuals from an
ARMA(p, q)fit, in which case the references suggest a better approximation to the null-hypothesis distribution is obtained by settingfitdf = p+q, provided of course thatlag > fitdf.?stats::Box.test()
# Ruído branco gaussiano
set.seed(42); z <- rnorm(100)
plot(z, type = 'l', main = 'Ruído branco gaussiano N(0,1)')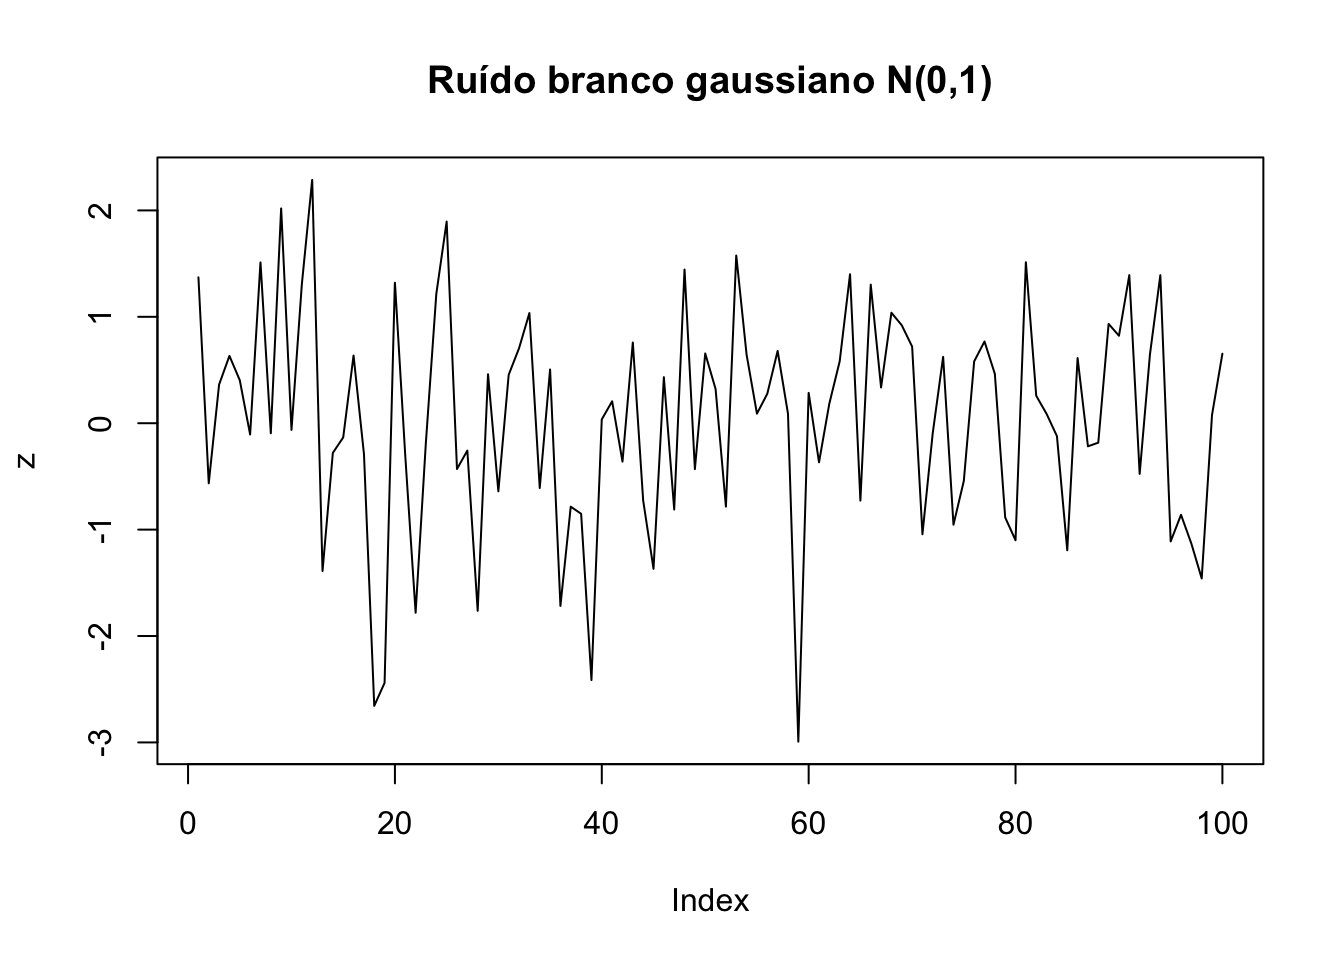
##
##  Box-Pierce test
##
## data:  z
## X-squared = 0.31274, df = 1, p-value = 0.576##
## Box-Ljung test
##
## data: z
## X-squared = 0.32222, df = 1, p-value = 0.5703
##
##  Box-Pierce test
##
## data:  lh
## X-squared = 15.899, df = 1, p-value = 6.682e-05##
## Box-Ljung test
##
## data: lh
## X-squared = 16.914, df = 1, p-value = 3.912e-05
##
##  Box-Pierce test
##
## data:  h02
## X-squared = 116.23, df = 1, p-value < 2.2e-16##
## Box-Ljung test
##
## data: h02
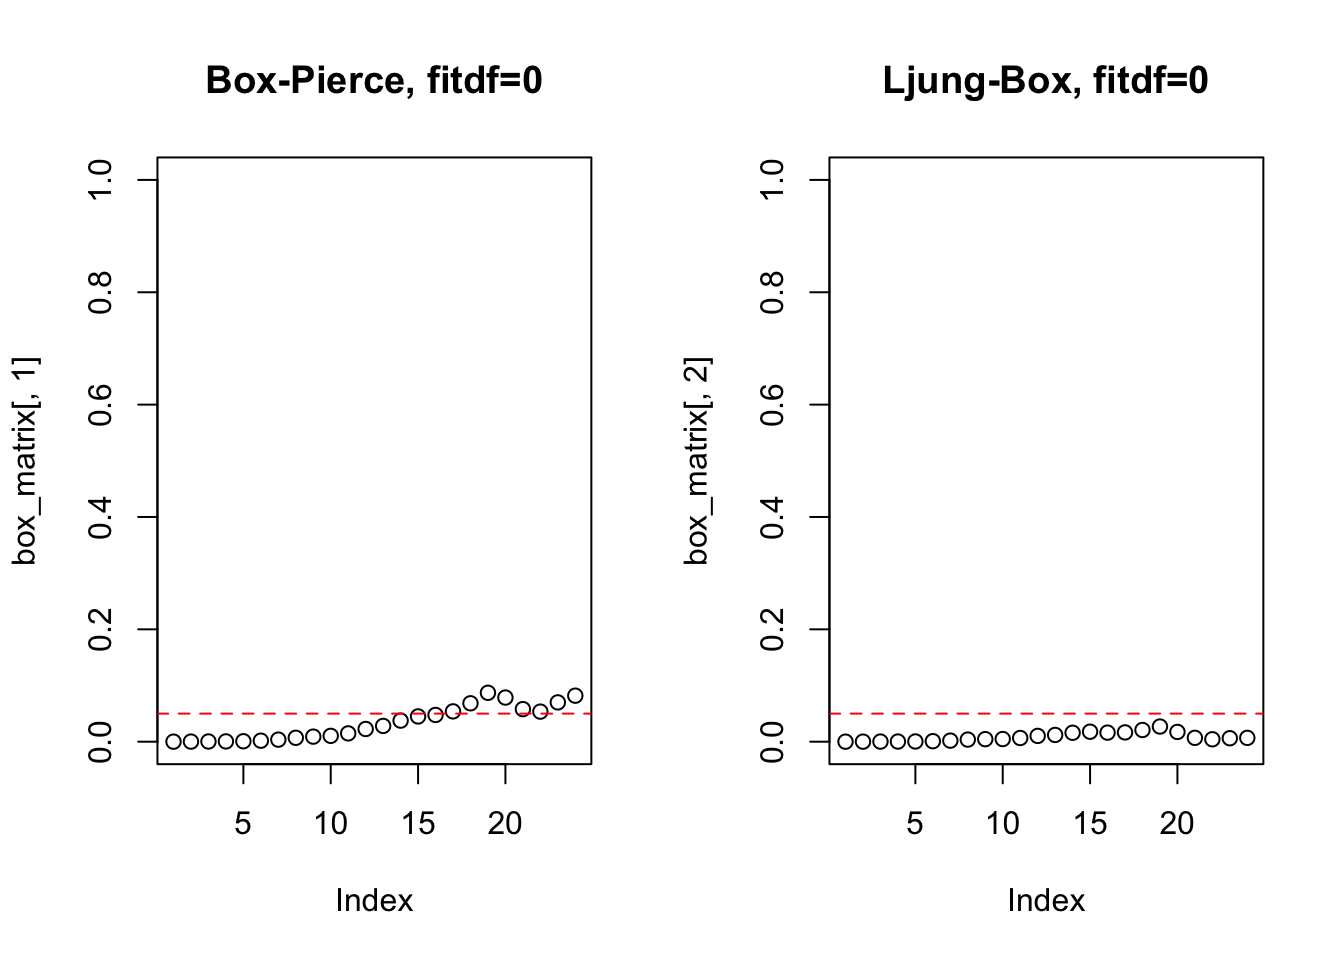
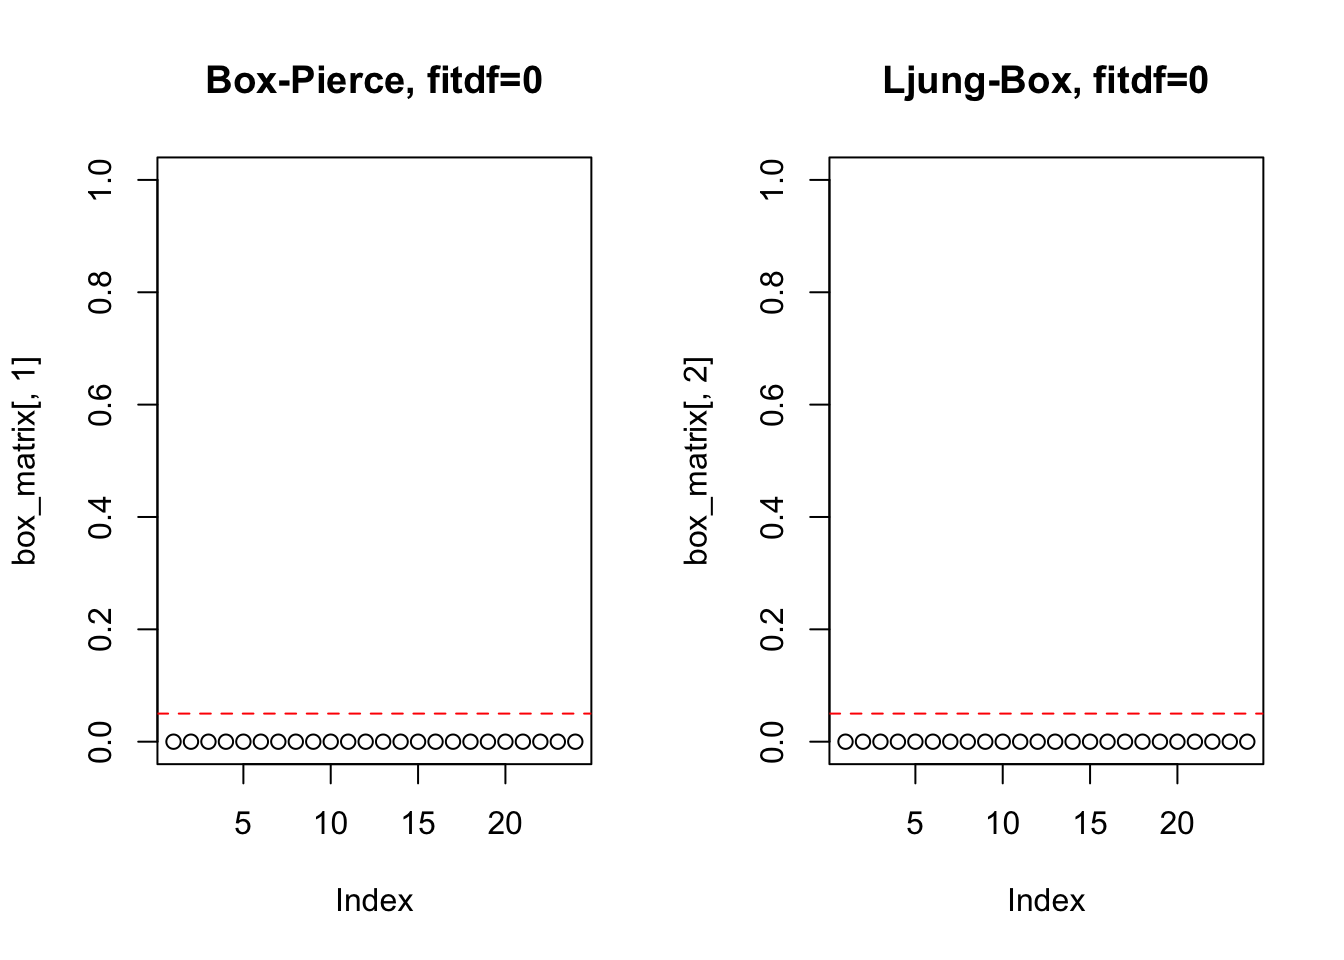
## X-squared = 117.95, df = 1, p-value < 2.2e-16Podem-se testar vários lags.
box_test <- function(x, lag.max = 24, fitdf = 0){
  par(mfrow=c(1,2))
  box_matrix <- matrix(NA, nrow = lag.max, ncol = 2)
  for(m in (fitdf+1):lag.max){
    box_matrix[m,1] <- Box.test(x, lag = m, type = 'Box', fitdf = fitdf)$p.value
    box_matrix[m,2] <- Box.test(x, lag = m, type = 'Ljung', fitdf = fitdf)$p.value
  }
  plot(box_matrix[,1], main = paste0('Box-Pierce, fitdf=', fitdf), ylim = c(0,1))
  abline(h = 0.05, col = 'red', lty = 2)
  plot(box_matrix[,2], main = paste0('Ljung-Box, fitdf=', fitdf), ylim = c(0,1))
  abline(h = 0.05, col = 'red', lty = 2)
}
11.8.2 Estacionariedade e raízes unitárias
[T]he main goal of classical time series is the analysis of the second order structure of stationary processes. (Douc, Moulines, and Stoffer 2014, 61)
11.8.2.1 KPSS
By testing both the unit root hypothesis and the stationarity hypothesis, we can distinguish series that appear to be stationary, series that appear to have a unit root, and series for which the data (or the tests) are not sufficiently informative to be sure whether they are stationary or integrated. (Kwiatkowski et al. 1992, 20)
A função tseries::kpss.test() calcula o teste Kwiatkowski-Phillips-Schmidt-Shin (KPSS) para a hipótese nula de que a série é nível ou tendência estacionária a partir de (Kwiatkowski et al. 1992). A função urca::ur.kpss() implementa o mesmo teste, mas retorna apenas a estatística do teste sem o p-value.
De acordo com (Rob J. Hyndman and Khandakar 2008, 10), o teste KPSS é utilizado para encontrar o argumento \(d\) do modelo ARIMA\((p,d,q)\) para séries não sazonais através da função forecast::auto.arima().
##
##  KPSS Test for Level Stationarity
##
## data:  z
## KPSS Level = 0.076489, Truncation lag parameter = 4, p-value = 0.1##
## KPSS Test for Level Stationarity
##
## data: lh
## KPSS Level = 0.29382, Truncation lag parameter = 3, p-value = 0.1##
## KPSS Test for Level Stationarity
##
## data: h02
## KPSS Level = 2.5973, Truncation lag parameter = 4, p-value = 0.0111.8.2.2 Teste Aumentado Dickey-Fuller
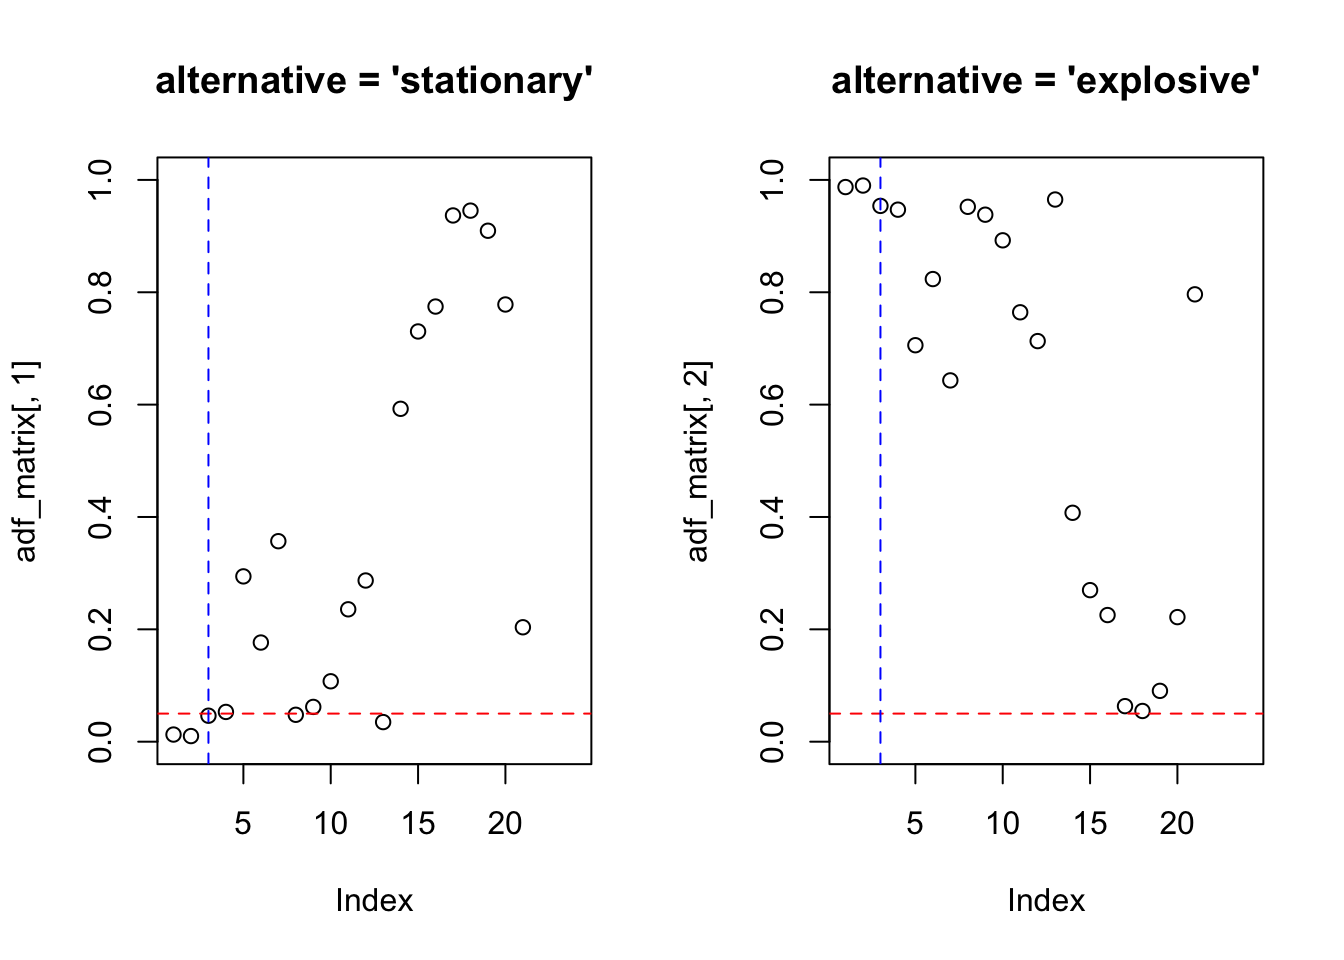
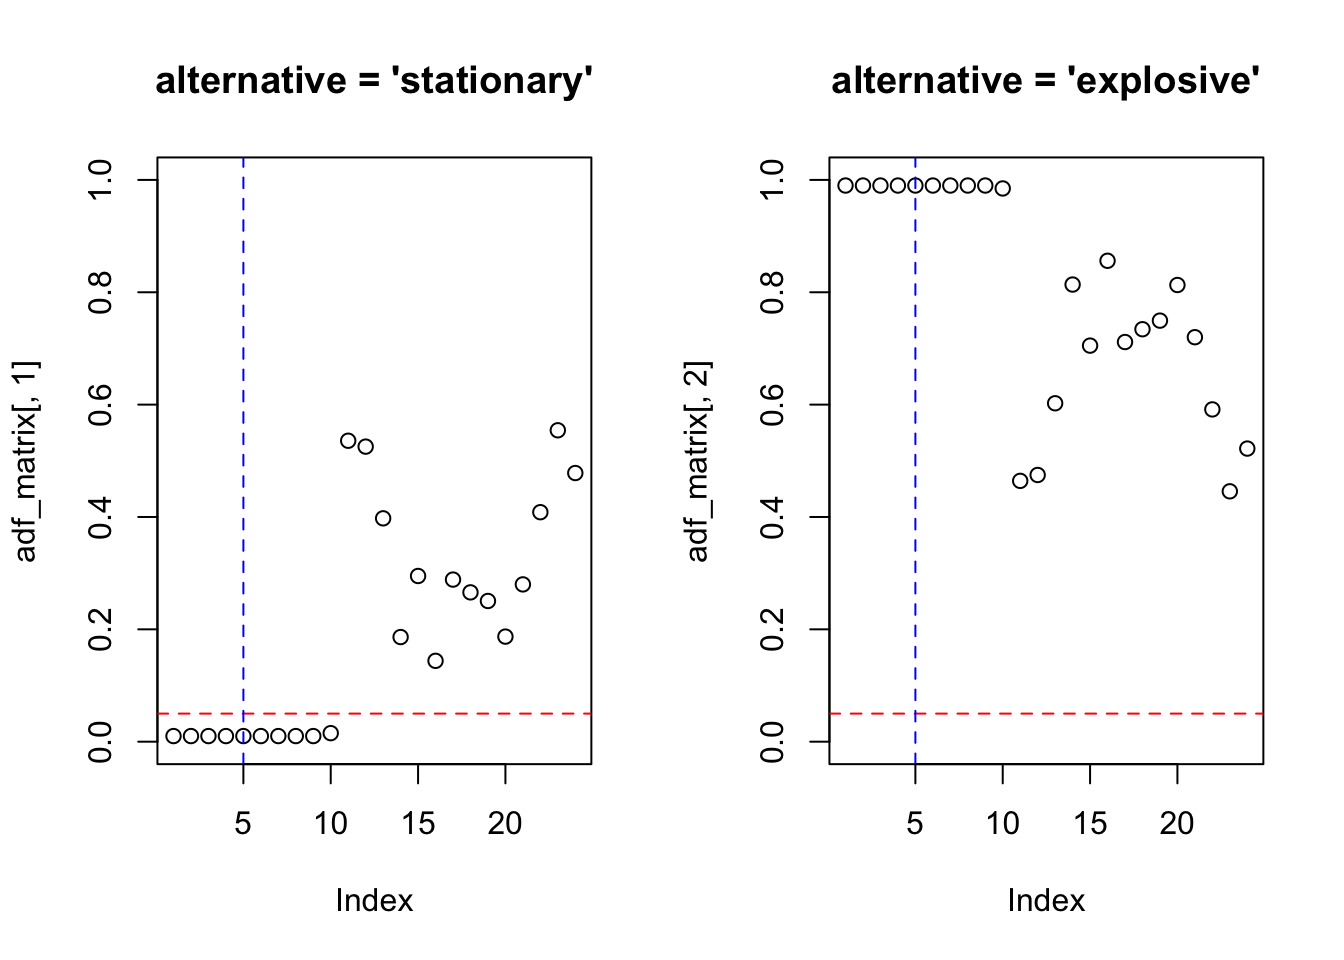
A função tseries::adf.test() calcula o teste Aumentado de Dickey-Fuller (ADF) para a hipótese nula de que a série tem uma raiz unitária, baseado em (Said and Dickey 1984) e (Banerjee et al. 1993). Valores ausentes não são permitidos, e quando número de defasagens usado é k igual a zero, o teste padrão Dickey-Fuller é computado. O valor padrão de trunc((length(x)-1)^(1/3)) corresponde ao limite superior sugerido na taxa na qual o número de defasagens, \(k\), deve ser feito para crescer com o tamanho da amostra para a configuração geral \(ARMA(p,q)\). Os valores p são interpolados da Tabela 4.2 de (Banerjee et al. 1993, 103). Se a estatística computada estiver fora da tabela de valores críticos, uma mensagem de aviso será gerada.
# Ruído branco gaussiano
tseries::adf.test(z, alternative = 'stationary') # alternative = 'stationary' é o padrão
##
## Augmented Dickey-Fuller Test
##
## data: z
## Dickey-Fuller = -3.9236, Lag order = 4, p-value = 0.01573
## alternative hypothesis: stationary##
## Augmented Dickey-Fuller Test
##
## data: z
## Dickey-Fuller = -3.9236, Lag order = 4, p-value = 0.9843
## alternative hypothesis: explosive##
## Augmented Dickey-Fuller Test
##
## data: lh
## Dickey-Fuller = -3.558, Lag order = 3, p-value = 0.04624
## alternative hypothesis: stationary##
## Augmented Dickey-Fuller Test
##
## data: lh
## Dickey-Fuller = -3.558, Lag order = 3, p-value = 0.9538
## alternative hypothesis: explosive# Monthly corticosteroid drug subsidy in Australia from 1991 to 2008
tseries::adf.test(h02, alternative = 'stationary')##
## Augmented Dickey-Fuller Test
##
## data: h02
## Dickey-Fuller = -9.5147, Lag order = 5, p-value = 0.01
## alternative hypothesis: stationary##
## Augmented Dickey-Fuller Test
##
## data: h02
## Dickey-Fuller = -9.5147, Lag order = 5, p-value = 0.99
## alternative hypothesis: explosivePodem-se testar vários lags.
adf_test <- function(x, lag.max = 24){
  par(mfrow=c(1,2))
  adf_matrix <- matrix(NA, nrow = lag.max, ncol = 2)
  for(m in 1:lag.max){
    adf_matrix[m,1] <- tseries::adf.test(x, alternative = 'stationary', k = m)$p.value
    adf_matrix[m,2] <- tseries::adf.test(x, alternative = 'explosive', k = m)$p.value
  }
  plot(adf_matrix[,1], main = "alternative = 'stationary'", ylim = c(0,1))
  abline(h = 0.05, col = 'red', lty = 2)
  abline(v = trunc((length(x)-1)^(1/3)), col = 'blue', lty = 2)
  plot(adf_matrix[,2], main = "alternative = 'explosive'", ylim = c(0,1))
  abline(h = 0.05, col = 'red', lty = 2)
  abline(v = trunc((length(x)-1)^(1/3)), col = 'blue', lty = 2)
}
11.8.2.3 Teste de Phillips-Perron
While the Dickey-Fuller approach accounts for the autocorrelation of the first-differences of a series in a parametric fashion by estimating additional nuisance parameters, this new approach deals with this phenomenon in a nonparametric way. (Perron 1988, 297)
A função tseries::pp.test() calcula o teste de Phillips-Perron para a hipótese nula de que a série tem uma raiz unitária, baseada em (Perron 1988) e (Banerjee et al. 1993).
##
##  Phillips-Perron Unit Root Test
##
## data:  z
## Dickey-Fuller Z(alpha) = -94.063, Truncation lag parameter = 3, p-value = 0.01
## alternative hypothesis: stationary##
## Phillips-Perron Unit Root Test
##
## data: lh
## Dickey-Fuller Z(alpha) = -22.224, Truncation lag parameter = 3, p-value = 0.02442
## alternative hypothesis: stationary##
## Phillips-Perron Unit Root Test
##
## data: h02
## Dickey-Fuller Z(alpha) = -87.279, Truncation lag parameter = 4, p-value = 0.01
## alternative hypothesis: stationary11.8.2.4 Elliott-Rothenberg-Stock
##
## ###############################################################
## # Elliot, Rothenberg and Stock Unit Root / Cointegration Test #
## ###############################################################
##
## The value of the test statistic is: -1.6828##
## ###############################################################
## # Elliot, Rothenberg and Stock Unit Root / Cointegration Test #
## ###############################################################
##
## The value of the test statistic is: -2.8503##
## ###############################################################
## # Elliot, Rothenberg and Stock Unit Root / Cointegration Test #
## ###############################################################
##
## The value of the test statistic is: -2.430511.8.2.5 Schmidt-Phillips
##
## ###################################################
## # Schmidt-Phillips Unit Root / Cointegration Test #
## ###################################################
##
## The value of the test statistic is: -7.6232##
## ###################################################
## # Schmidt-Phillips Unit Root / Cointegration Test #
## ###################################################
##
## The value of the test statistic is: NaN##
## ###################################################
## # Schmidt-Phillips Unit Root / Cointegration Test #
## ###################################################
##
## The value of the test statistic is: NaN11.8.2.6 Zivot-Andrews
##
## ################################################
## # Zivot-Andrews Unit Root / Cointegration Test #
## ################################################
##
## The value of the test statistic is: -10.0143##
## ################################################
## # Zivot-Andrews Unit Root / Cointegration Test #
## ################################################
##
## The value of the test statistic is: -4.5332##
## ################################################
## # Zivot-Andrews Unit Root / Cointegration Test #
## ################################################
##
## The value of the test statistic is: -7.483911.8.3 Cointegração
Quando \(X_t\) e \(Y_t\) são \(I(1)\) e se há um \(\theta\) tal que \(Y_t−\theta X_t\) é \(I(0)\), \(X_t\) e \(Y_t\) são cointegrados. Em outras palavras, a cointegração de \(X_t\) e \(Y_t\) significa que \(X_t\) e \(Y_t\) têm a mesma tendência estocástica ou uma tendência estocástica comum e que essa tendência pode ser eliminada tomando uma diferença específica da série de modo que a série resultante seja estacionária. (Hanck et al. 2024, 394)
A series with no deterministic component which has a stationary, invertible, ARMA representation after differencing \(d\) times, is said to be integrated of order \(d\), denoted \(x_t \sim I(d)\). (R. F. Engle and Granger 1987, 252)
A função aTSA::coint.test() executa testes de Engle-Granger para a hipótese nula de que duas ou mais séries temporais, cada uma das quais é \(I(1)\), não são cointegradas.
set.seed(1); X <- matrix(rnorm(200),100,2)
set.seed(2); y <- 0.3*X[,1] + 1.2*X[,2] + rnorm(100)
aTSA::coint.test(y,X)
## Response: y
## Input: X
## Number of inputs: 2
## Model: y ~ X + 1
## -------------------------------
## Engle-Granger Cointegration Test
## alternative: cointegrated
##
## Type 1: no trend
## lag EG p.value
## 4.00 -5.30 0.01
## -----
## Type 2: linear trend
## lag EG p.value
## 4.000 -0.731 0.100
## -----
## Type 3: quadratic trend
## lag EG p.value
## 4.000 0.646 0.100
## -----------
## Note: p.value = 0.01 means p.value <= 0.01
## : p.value = 0.10 means p.value >= 0.10## Response: diff(y,1)
## Input: diff(X,1)
## Number of inputs: 2
## Model: y ~ X - 1
## -------------------------------
## Engle-Granger Cointegration Test
## alternative: cointegrated
##
## Type 1: no trend
## lag EG p.value
## 4.00 -7.40 0.01
## -----
## Type 2: linear trend
## lag EG p.value
## 4.000 -0.174 0.100
## -----
## Type 3: quadratic trend
## lag EG p.value
## 4.0000 0.0401 0.1000
## -----------
## Note: p.value = 0.01 means p.value <= 0.01
## : p.value = 0.10 means p.value >= 0.1011.8.4 Testes de quebra estrutural
O pacote strucchange (Zeileis et al. 2002), (Zeileis et al. 2003), (Zeileis 2006) apresenta testes/métodos da estrutura de teste de flutuação generalizada, bem como da estrutura de teste F (teste de Chow). Isso inclui métodos para ajustar, plotar e testar processos de flutuação (por exemplo, CUSUM, MOSUM, estimativas recursivas/móveis) e estatísticas F, respectivamente. É possível monitorar dados recebidos on-line usando processos de flutuação. Finalmente, os pontos de interrupção em modelos de regressão com mudanças estruturais podem ser estimados junto com intervalos de confiança.
library(strucchange)
library(tstests)
# teste F de Chow
sctest(z ~ 1, type = 'Chow', point = 10) # ruído branco gaussiano
##
## Chow test
##
## data: z ~ 1
## F = 2.7636, p-value = 0.09963##
## Chow test
##
## data: h02 ~ 1
## F = 21.902, p-value = 5.253e-06##
## Score-based CUSUM test with mean L2 norm
##
## data: z ~ 1
## f(efp) = 0.45443, p-value = 0.2163##
## Score-based CUSUM test with mean L2 norm
##
## data: h02 ~ 1
## f(efp) = 9.5709, p-value = 0.005##
## Recursive CUSUM test
##
## data: z ~ 1
## S = 0.7817, p-value = 0.1549##
## Recursive CUSUM test
##
## data: h02 ~ 1
## S = 3.6987, p-value < 2.2e-16##
## Recursive MOSUM test
##
## data: z ~ 1
## M = 0.92666, p-value = 0.3234##
## Recursive MOSUM test
##
## data: h02 ~ 1
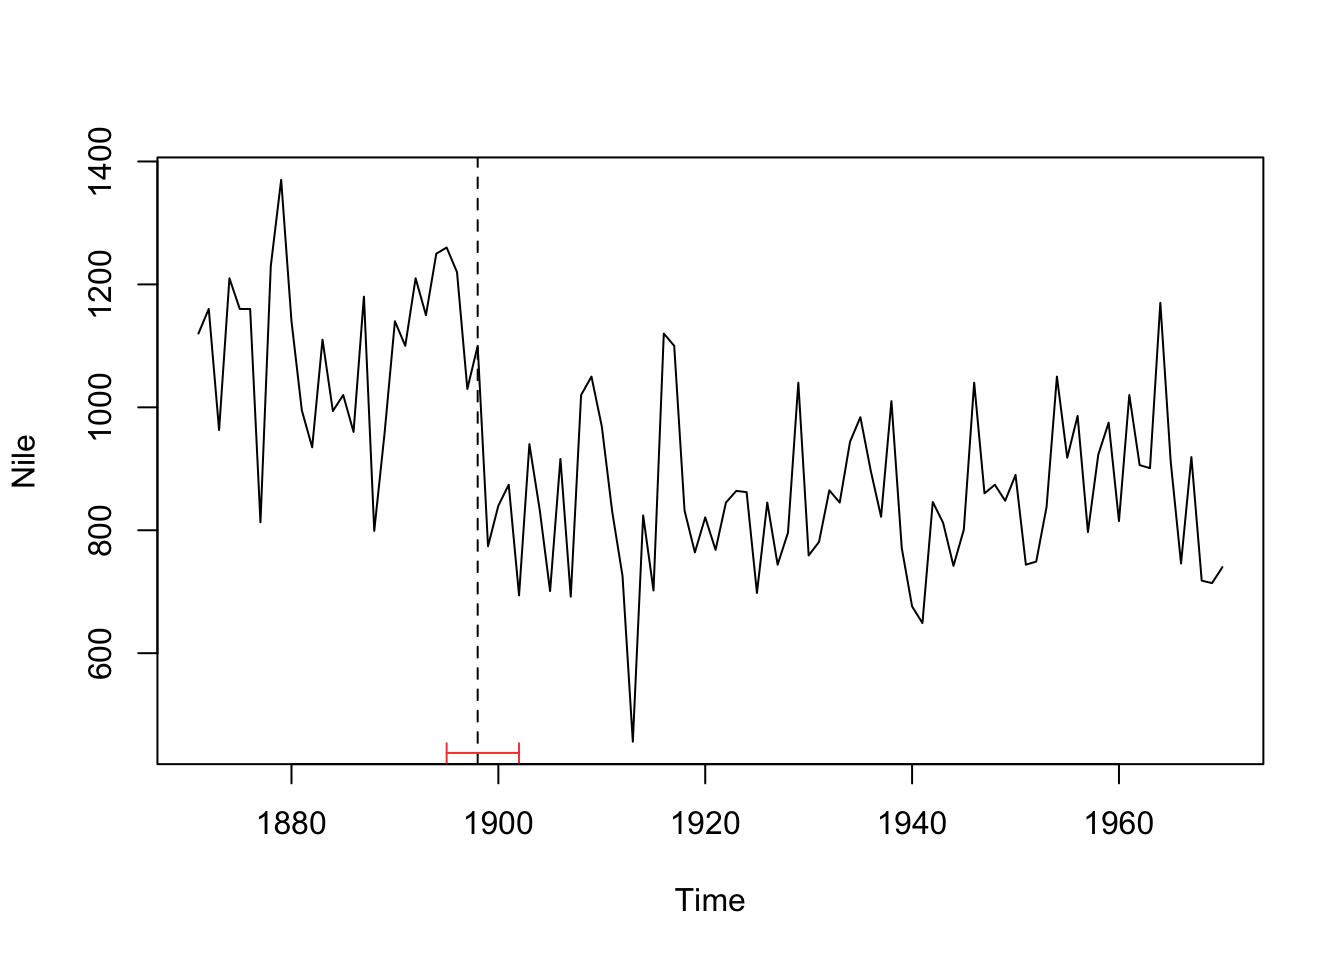
## M = 2.9991, p-value = 0.01## dating breaks
plot(Nile)
bp.nile <- breakpoints(Nile ~ 1)
ci.nile <- confint(bp.nile, breaks = 1)
lines(ci.nile)
11.8.5 Outros testes
11.8.5.1 Testes de Friedman e Nemenyi
A função tsutils::nemenyi() (Kourentzes 2023) realiza comparações múltiplas não paramétricas, entre colunas, usando o teste de Friedman (M. Friedman 1937) e o teste post-hoc de Nemenyi (Nemenyi 1963).
library(tsutils)
x <- matrix( rnorm(50*4,mean=0,sd=1), 50, 4)
x[,2] <- x[,2]+1
x[,3] <- x[,3]+0.7
x[,4] <- x[,4]+0.5
colnames(x) <- c('Method A','Method B','Method C - long name','Method D')
nemenyi(x, conf.level=0.95, plottype='vline')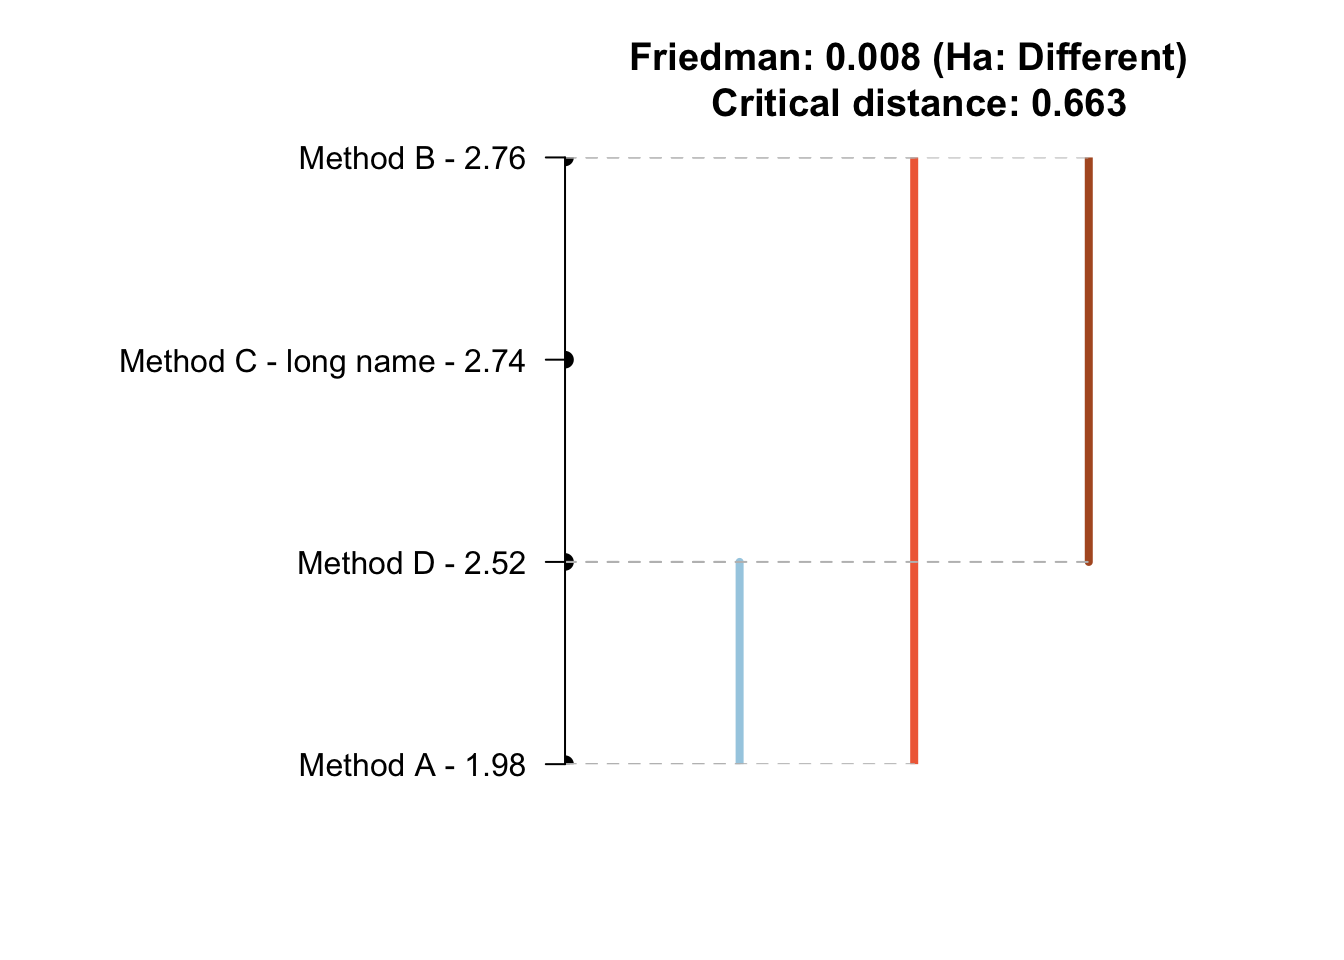
## Friedman and Nemenyi Tests
## The confidence level is 5%
## Number of observations is 50 and number of methods is 4
## Friedman test p-value: 0.0078 - Ha: Different
## Critical distance: 0.6633